Earthquakes Do Favor Certain Times of the Day and Year (Not a Myth)

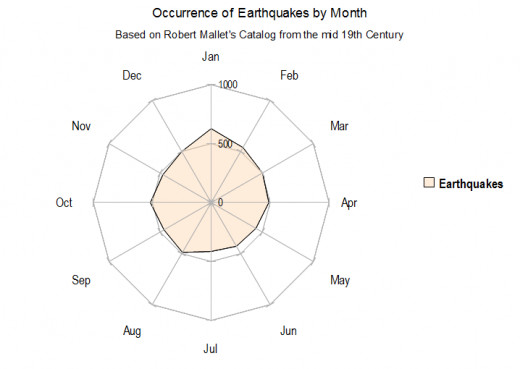
A typical seismologist will probably be thinking "hogwash" as he reads the title of this hub. But I do have something to back the title up with on this. The above graphic is based on a presentation by Robert Mallet in the mid 19th Century (shown below) where he demonstrates that there are obviously more earthquakes in January (when the earth is closest to the sun in its orbit) and less in July (when the earth is furthest from the sun in its orbit). This data shows that the January numbers represent 1.3Xs more than the average and the July numbers are 15% less than the average. Looks pretty good to me when considering that it is based on 5,879 events.
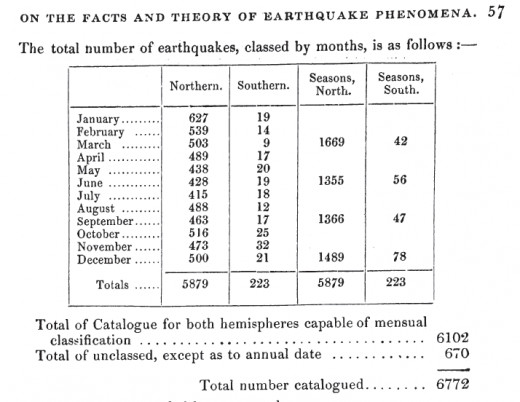
One factor about the massive catalog that he labored over for years and finally had printed in the Transactions of the British Association for the Advancement of Science (1852-1858) was that, since it went very far back in time, most of the earthquakes that he listed were very destructive and very deadly. In the old days, unless it was an earthquake that created much mayhem, it wasn't worth chronicling.
What I'm getting at is the reason why the skeptics say that they can prove that earthquakes are random. What they predictably do is insist that seismic events as low as 5.0 magnitude or lower be included in a statistical study to show that there is nothing to the notion that earthquakes show favoritism when it comes to time accounting. Whether they intend to do it or not, by including small quakes, which I believe are mostly random (not to mention much more numerous than those more noteworthy shakers) they create more noise or static in the data and thus drown out any possible significance.
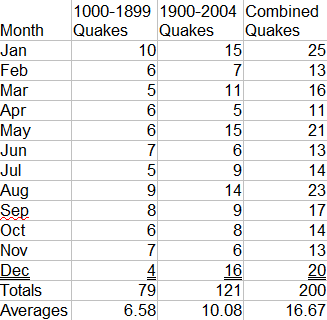
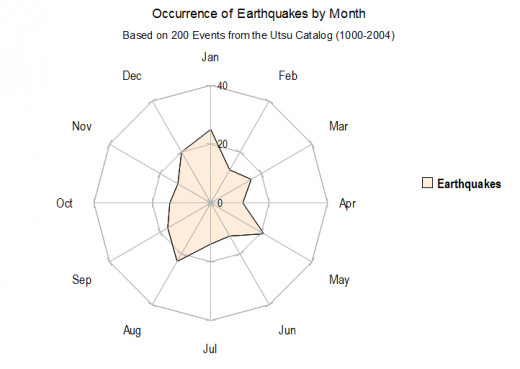
If one looks instead at the solid core of significant data, say those with at least 1,000 fatalities (for 20th Century or later quakes) or 10,000 (for those prior to 1900), one sees a pattern that parallels what Mallet found 150 years ago (as shown in the table below). Although we are only dealing with 200 earthquakes it should be noted that the results don't contradict what Mallet found. The January numbers actually are 1.5Xs higher than the average (and the July numbers 8.4% less than the average).
I hope that some of you are thinking "if the earth being closer to the sun brings on more earthquakes, how about the moon in close proximity to the earth". Well, if you thought that, I'm ready for you..
The moon is closest to the earth, or at perigee, when its apparent motion in longitude is also greatest. By knowing that fact and that it's maximum arc traveled in 24 hours is about 15deg30min of longitude, I can determine how often it is closest to earth in its orbit. With the help of a handy computer program, I have found that, for the period from 1850.0 to 1981.0, the moon traveled at a daily speed of equal to or greater than 15 degrees 4.39% of the time. Of the 223 charts that I have in my database of significant worldwide earthquake events for the same period, 18 or 8.07% fit those parameters. That comes out to be 1.84Xs more quake events than what would normally be expected. The moon happens to be at perigee all day on January 10, 2013 (eastern time). That date also happens to be within an 8.5 day earthquake window of mine, which it would be with or without the perigee.
Now for my next impossible mission, I'll present a correlation between earthquakes and the day of the week! Just kidding; even though Sunday was named after the sun and Monday after the moon, I'll skip looking for any correlation there.
However, I will give a cursory look at earthquakes as related to the hours of the day. Since the time of day bears a relationship to the sun, and I believe that I've demonstrated that the sun does influence the frequency of earthquakes somewhat, I'll give that a shot.
Doing so isn't easy however. Almost all of my earthquake data, with the exception of my oldest notes on the subject, list the occurrence of the events in Greenwich Mean Time or Universal Time (GMT or UT). To find a time correlation one has to use local time. Ideally, Local Mean Time would be perfect (which was used in the old days before time zones), but to convert hundreds of records from GMT to LMT would take a great deal of time and effort. What I present first is the work I did before I decided to tackle that task (followed by the more complete and convincing data).
What I have done for now is explored my old notes and listed local times for 43 significantly important earthquakes. You can see the results below in my radar graphic of events on a 24 hour clock in 2 hour increments. As one can see, there is an active period from 4pm till midnight (however 6pm to 8pm is about average), but the peak with the greatest significance or about twice the average is at 2am-4am (an average segment follows in the 4am-6am slot).
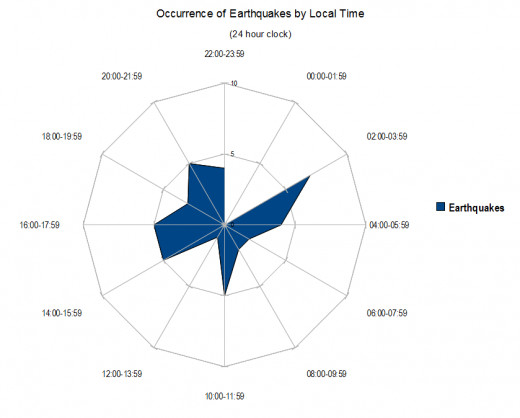
The weakest showing is the two hours before that (midnight to 2am) with no quakes contributing (the only such occurrence of the 12 segments). Another isolated peak that is a bit above average is the two hours prior to noon. The three remaining segments, 6am to 10am and noon to 2pm, are below average.
Interestingly, to me at least, is the novelty that the 2am-4am and 2pm-4pm axis has the highest number of earthquakes (12 or 1.67Xs the average), while the immediately preceding axis of 12am-2am and 12pm-2pm has the lowest number of earthquakes (1 or about 1/7th of the average).
This last exploration is of course not definitive, but I feel that it shows enough promise to look into the matter more comprehensively at a later date.
Copyright © 2013 Joseph W. Ritrovato
4Xs+ More Events Shows Fickle Finger of Fate
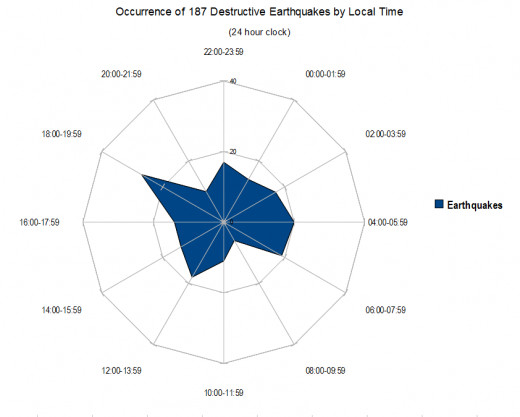
Since I wasn't satisfied that I had achieved a good enough result using the times of just 43 earthquake occurrences in the earlier evaluation, I set out to convert Greenwich Mean Times (GMT) of destructive/deadly earthquake events to Local Mean Time (LMT). Now, based on 187 events (with an average of 15.6 events per 2 hour segment of the 24 hour clock), the new results shine a new light on the matter. Similar to the earlier results for frequency by month where January stood out strongly from the rest, the 2 hour period from 6pm-7:59pm stand out clearly from the rest as a danger zone (1.7Xs the average value). Also noteworthy in the display below is a relatively safe period from 8am-9:59am where quakes are only 38.5% of the average value (or about 3Xs less than the average). Put another way, it appears as though this later time period is 4.5Xs less dangerous than the 6pm-7:59pm period.
5Xs More Events and a Narrower Focus
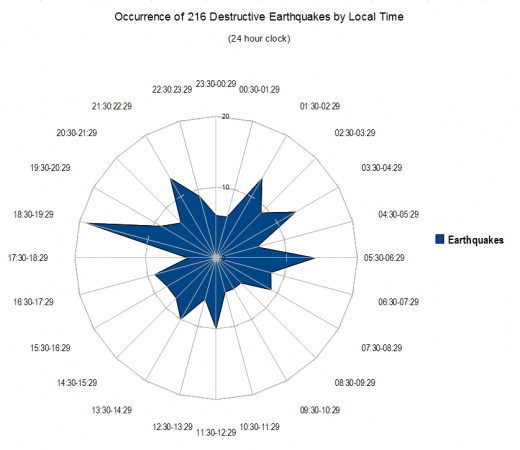
This time I have built an even stronger case for earthquakes favoring or avoiding certain hours of the day. In adding a few dozen more events and narrowing the focus from 2 hour increments to 1 hour ones, I have produced a graphic that shows greater contrast between hours with the highest number of earthquakes and those with the lowest number. The average rate is 9 events per hour and the hour centered on a local event time of 7pm, has 2.1Xs more events than that average. The hour before that has the lowest value or 44.44% of the average value (less than half of the average). This time the difference between the hour with the highest and the one with the lowest value in 4.75Xs. Another interesting phenomena here is the low point spread out over 3 hours (at 10am, give or take 1.5 hours). Those hours are 55.55% of the average hourly value. That happens to be directly across from one of the stronger or above average hours (centered on 10pm). That last hour (along with hours 2am and 4am) has an hourly event value 1.48Xs that of the average. The second highest hour, which is 1.59Xs that of the average hourly value, is centered on 6am. That is directly across from the hour with the lowest hourly event rate.
And Lastly, the Hourly Breakdown of Earthquakes in the USA
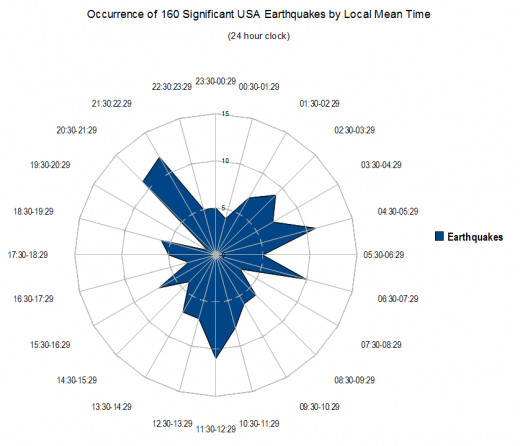
After being careful not to use events that had the local time, since that can be way different than the local mean time due to daylight savings time and/or a longitude value at an extreme from the time zone average, I came up with 160 event (LMT) times in the USA to input into a spreadsheet and create the display below. The largest peak of 12 events at 10pm is 1.8Xs that of the 6.67 event average. The hour just before it (9pm) is one of three hours tied for second with 11 events per hour and are 1.65Xs the average. The other two are in the 5am and Noon hour positions. In third place is the 7am hour slot with 10 events or 1.5Xs the average. Perhaps the most striking hour is the almost total lack of events, there was just 1, in the 8pm slot or almost 1/7th the average value. Also interesting is the fact that this last hour is just before a double hour peak and is also directly across from the hour with the second least number of events (8am with just 3 events).
This Hub Inspired in part by this book:

© 2013 Joseph Ritrovato


