How can you work out where a graph crosses the x axis or y axis.

To find out where a graph crosses the y - axis all you need to do is substitute x = 0 into the equation and find the value of the y coordinate.
To find out where a graph crosses the x – axis all you need to do is substitute y = 0 into the equation and find the value of the x coordinate.
Example 1
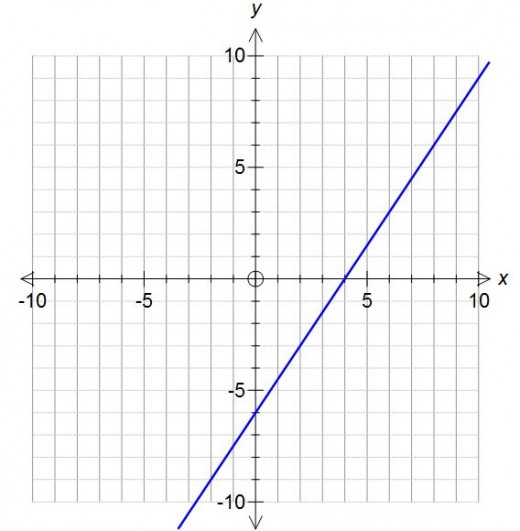
Find out the points where the graph 3x – 2y = 12 crosses the x and y axis.
First find out where the graph crosses the y axis. Do this by subbing in x = 0 and solving the resulting equation:
3x – 2y = 12
3 × 0 – 2y = 12
-2y = 12
y = 12/-2
y = -6
So the graph crosses the y axis at (0,-6)
Next find out where the graph crosses the x axis. Do this by subbing in y = 0 and solving the resulting equation:
3x – 2y = 12
3x – 2 × 0 = 12
3x = 12
x = 12/3
x = 4
So the graph crosses the x axis at (4,0)
By drawing the graph of 3x – 2y = 12 you can see that these two values are correct.
Example 2
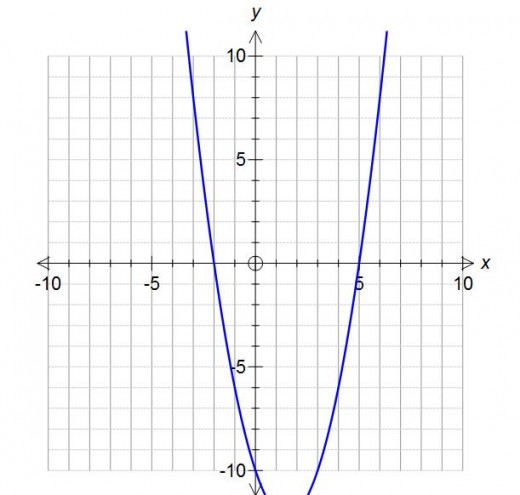
Find out the points where the graph y = x² - 3x - 10 crosses the x and y axis.
First find out where the graph crosses the y axis. Do this by subbing in x = 0 and solving the resulting equation:
y = x² - 3x - 10
y = 0² - 3 × 0 – 10
y = -10
So the graph crosses the y axis at (0,-10)
Next find out where the graph crosses the x axis. Do this by subbing in y = 0 and solving the resulting equation:
y = x² - 3x - 10
0 = x² - 3x - 10
This is a quadratic equation so you need to factorise this equation in order to solve it:
0 = (x-5)(x+2)
So either x – 5 = 0 or x + 2 = 0
So x = 5 or x = -2
So the graph crosses the x axis at (5,0) and (-2,0)
By drawing the graph of y = x² - 3x - 10 you can see that these values are correct.

")

