What Is a Data Flow Diagram? and Dfd Symbols

Data Flow Diagrams Defined
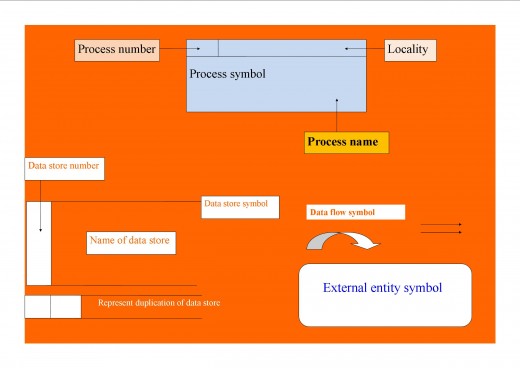
Data flow diagram is a geographical tool that shows, process, flows, stores and external entities in a system. Dataflow diagram shows the transformation of data into a system. Dfd has got the following symbols
Process flow diagrams
Process symbol has got the following entities, process number (tells the number of the process), locality (where activity is happening) and a process name
Data flow datagram process symbol rules
· It symbolizes the transformation of data
· There must be data flowing into/out of the process
· Process can have several inputs to it or output to it
· Process with no out becomes a null process
Data store Symbol
Consist of the following entities, data store number and name of data store. The function of data store is to designate the storage of data in a dfd diagram
Rules of Data store
· dfd data store do not by level but they may reappear incase needed
· The symbol and the numbering remain the same
Data flow symbol
Data flow symbol may appear in different shape and they signify the movement of data. They do not signify the movement of people, goods etc
· Doubles arrows signifies that activities occur at the same time which is wrong
· Data flow in is never equal to data flow out
Extended entity symbol
Extended entity is sources and destination of data. This means that source is the origin and destination is the sink of data
Dos and Don’ts of external entity
· External entity never communicate with each other, this signify that there is no need for the process
· External entity should not communicate directly with data store because external entities can be identifier with the record of files and databases
How to develop Logical data flow diagram
Below are the guidelines in developing data flow diagrams
- Develop a physical dfd
- Explore the process for more details
- Maintain consistency between the process
- Following meaningful leveling convention
- Ensure that dfd diagrams clarifies what is happening in the system
- Remember dfd audience
- Add control on the lower level dfd only
- Assign meaningful level
- Evaluate dfd for correctness
Step in drawing dfd diagrams
- Make a list of all business activities and use it to determine the various external entities, data flows, process and data store
- Create a context diagram which shows external entity and data flows to and from the system
- Do not show any detailed process or data store
- Draw diagram zero or the next level to show process but keep them general. Show data stores and the level
- Create a child diagram for each of the process in diagram zero
- Check for errors and make sure the levels you assign to each process and data flow are meaningful
- Develop a physical dfd diagram from the logical dfd and distinguish between the manual and automated protocol, describe actual files and report by name and controls to indicate when the process are complete or errors occurs
- Portion the physical DFD by separating or grouping parts of the diagram in order to facilitate programming and implementation
Advantages of data flow diagrams
- It gives further understanding of the interestedness of the system and sub-systems
- It is useful from communicating current system knowledge to the user
- Used as part of the system documentation files
- Dataflow diagram helps to substantiate the logic underlining the dataflow of the organization
- It gives the summary of the system
- DFD is very easy to follow errors and it is also useful for quick reference to the development team for locating and controlling errors
Disadvantages of data flow diagram
- DFD is likely to take many alteration before agreement with the user
- Physical consideration are usually left out
- It is difficult to understand because it ambiguous to the user who have little or no knowledge