Tips to Invest Better

Many of us make poor financial decisions for one fundamental reason: we don’t fully understand our overall financial situation.
You may, for example, own a large number of financial positions (e.g., stocks, bonds, retirement accounts, checking accounts, annuities, etc.) with multiple financial service providers, which prevents you from easily answering fundamental questions about your financial situation such as what percentage of your financial assets you have in stocks, or how much interest you’ll earn this year. Without such an overall understanding of your financial situation, it’s difficult or impossible to make the best decisions to help you reach your financial goals. It’s analogous to getting lost while driving: if you don’t know where you are now, you don’t know which way to turn to reach your destination. Step #1 for solving this problem is to find a convenient way to thoroughly understand your financial situation. As illustrated below, one convenient solution is to use a single spreadsheet to capture all your financial information in one place. This spreadsheet can then be adjusted and used to make better decisions.
To illustrate the problem, let’s take the case of a mid-career employee named Mr. Roberts. Mr. Roberts has accounts with 4 different financial institutions. He owns a brokerage account with Vanguard which contains positions in three exchange traded funds (ticker symbols DIA, DVY and IDU), and a brokerage account with Fidelity which contains three bond funds (ticker symbols FAGIX, FGMNX and FTFMX). He also owns an account with Treasury Direct which contains I-Bonds, and a checking account with a local bank. Thus, Mr. Roberts owns a total of 8 financial positions spread out among 4 financial accounts. In this respect, Mr. Roberts actually has a very simple financial situation in comparison with many people. It’s not uncommon for people to own a dozen or more financial accounts with 50 or more positions.
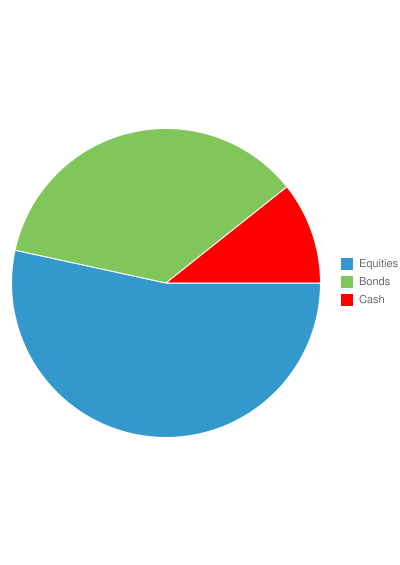
Mr. Roberts has decided he wants to act more pro-actively towards meeting his financial goals. Based on his research suggesting the optimum distribution of investments for people his age, Mr. Roberts has decided to split his investment portfolio so that 70% will be in equities, 20% in bonds, and 10% in cash. Unfortunately, Mr. Roberts doesn’t know what actions he needs to take to achieve this distribution. Should he sell some ETFs from his Vanguard account and use the proceeds to buy more of the bond funds in his Fidelity account? Should he invest new savings in his I-bond account with Treasury Direct? Does he have enough cash in his checking account, or does he have too much? While Mr. Roberts can look at the monthly statements from each of his financial service providers, they are of little help. Each monthly statement provides a snapshot of only a portion of Mr. Roberts’ investment portfolio without reference to the other portions, they are in different formats, and they arrive on different dates. While one of Mr. Roberts’ statements might provide a breakdown of his investments into the three categories in which he’s interested (i.e., equities, bonds and cash), this breakdown doesn’t reflect all of his assets.
A convenient solution to this problem is for Mr. Roberts to create a simple spreadsheet listing all of his positions with all of his financial service providers. In this example, Mr. Robert has used Google’s free spreadsheet program to create a single spreadsheet that lists all 8 of his financial positions at Fidelity, Vanguard, Treasury Direct and his local bank. This sample spreadsheet is shown at the following link: https://docs.google.com/spreadsheet/ccc?key=0AgNVGIW4KWbGdGpNMkhOQzdtV3RocnlrNlpTeGx2Q2c. As this spreadsheet shows, Mr. Roberts decided to include the following fields for each of his 8 positions: Symbol; Description; Last Trade Time; Price; Change; Change Percent; Shares; Market Value; Change Market Value; Dividend or Yield; Annual Income; and Federal Taxable Income. Many of these fields make use of GoogleFinance functions to automatically fill in the data using current information. For example, the market price of each ETF and bond fund position is automatically filled in using the GoogleFinance(“<ticker symbol>”;”Price”) function. Some of the fields are filled in manually by Mr. Roberts, such as the Dividend or Yield field which Mr. Roberts finds at the Yahoo Finance website, or the information about his I-bonds which Mr. Roberts transfers manually from his Treasury Direct account.
After creating this simple spreadsheet, Mr. Roberts finds it easy to decide what actions are necessary to achieve his desired distribution among equities, bonds and cash. The current percentages are calculated automatically in rows 13 through 15 of the spreadsheet, and show that Mr. Roberts’ overall percentage in cash needs no adjustment since it is already reasonably close to his desired percentage of 10%, but he should sell some shares of the bond funds in his Fidelity account and use the proceeds to buy additional ETFs in his Vanguard account to achieve his desired percentages of 70% in equities and 20% in bonds.
While Mr. Roberts includes only his 8 financial positions in his spreadsheet, he could have included other information about his overall financial position. For example, if Mr. Roberts has debts, he can easily add additional rows to his spreadsheet to include these debts (with negative values for Market Value and Dividend or Yield). Or, he could include the value of non-financial assets such as his cars or house. Once Mr. Roberts creates his initial spreadsheet, it is an easy matter to make use of the flexible nature of the spreadsheet program to make adjustments depending on what financial decision he is trying to make.
The use of a spreadsheet to capture a person’s overall financial situation in one place is a powerful tool to help people make better financial decisions for several reasons. First, by using features such as the GoogleFinance functions, data within the spreadsheet can be automatically updated to keep it current. In the example above, Mr. Roberts can use the spreadsheet to monitor his overall investment portfolio over time so he can then take appropriate actions as the values of his investments change. Second, the flexible nature of the spreadsheet makes it easy to monitor the portfolio for different characteristics. For example, by including the field for Federal Taxable Income, Mr. Roberts can easily estimate how much taxable income will be generated by his investment portfolio, and can use that information to estimate his marginal income tax bracket to help with deciding when to purchase taxable vs. non-taxable investments. Third, Mr. Roberts can easily include financial positions which might be difficult to include in some off-the-shelf financial management software packages. For example, Mr. Roberts is able to include a row to capture the value of his I-bond positions even though it would be difficult to automatically access this information using certain software packages. Fourth, the powerful graphical features of spreadsheet programs can be used to create graphical representations that make the information easier to digest, such as the pie chart accompanying this article. Fifth, the use of spreadsheet programs makes it simple to scale up to handle more complicated financial situations. For example, it would be easy for Mr. Roberts to add additional financial positions to his spreadsheet. Sixth, spreadsheet programs are readily available, easy to use, and inexpensive (or even free as with Google!).
By taking a small amount of time to consolidate information about all of your financial positions at all of your financial service providers, it becomes much easier to understand your overall financial situation. It then becomes much easier to make better financial decisions to help you reach your financial goals.