Predictions Of Sea Level Rise Prove Costly

Are The Predictions Right?
There are many predictions that sea levels will rise at least 1 meter by 2100. In the UK and other countries these predictions are being used as reason to flood land in an attempt to recreate inter tidal habitat or salt marsh which is being eroded.
Why is salt marsh important?
- Salt marshes are home to a wide variety of species, some rare and protected.
- In addition salt marsh reduces the energy of waves, and so protect sea walls.
Some estimates put the cost of these works at over £2billion for the UK alone. So it might be worth asking
- Are the predictions right?
- WIll the plans work?
In the UK responsibility for Environmental Affairs is split among a number of agencies who have to work with each other and whose names lead to a confusing alphabet soup. Here are 3.
DEFRA - Department for Environment Food and Rural Affairs is the lead agency
EA - Environment Agency is responsible for Environment, in particular shorelines
NE - Natural England is also responsible for Environment but focus more on farming and grants to farmers.
Any suggestion that having three agencies is just a means that they can each blame each other is obviously totally false and without foundation.
In 2006 DEFRA produced predictions of sea level rise from 1990 until 2115 which EA were required to use for their Shoreline Management Plan which outlines how EA plan to manage the coastal defences until 2115 and was submitted for government approval in 2010. In some locations EA intend to breach sea walls and flood farm land.
This is strange as DEFRA produced revised predictions in 2009 which were lower than the 2006 predictions.
Permanent Service for Mean Sea Level holds records of observations of sea levels from various locations around the world. Here are three of them with both the DEFRA 2006 and 2009 predictions.

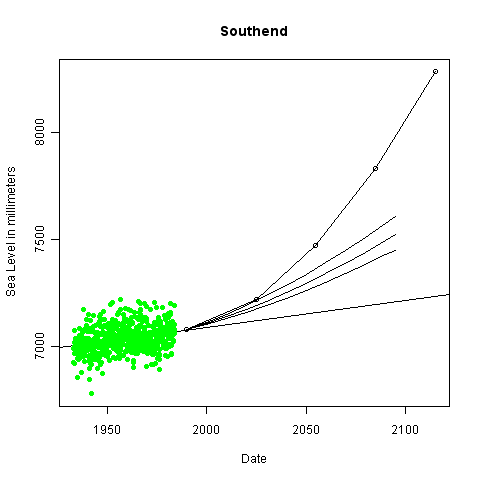
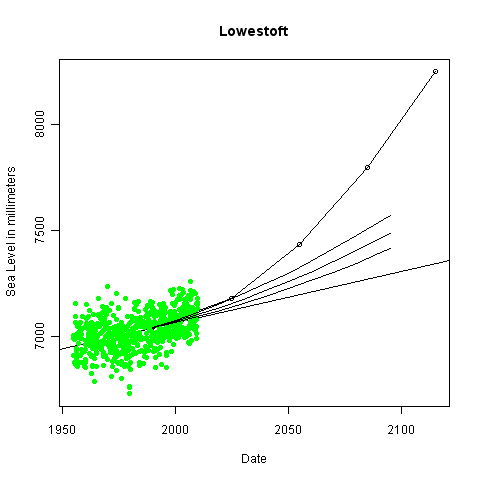
I live in Kirby le Soken, about 5 miles across a bay from Felixstowe. Southend is about 30 miles south and Lowestoft is about 40 miles north.
The vertical axis of the graphs shows the sea level in mm. The green dots are the monthly observations. The tidal range is about 4 meters here which is why the dots are spread about so much.
The lower line on each graph is a trend line.
The upper curves are the DEFRA 2006 predictions.
The three curves in the middle of each graph are the DEFRA 2009 predictions, this time there are 3 flavours of prediction, high, medium and low.
Do the DEFRA 2006 predictions seem likely to you?
How about any of the DEFRA 2009 predictions.
Or do you think that things will just carry on the way they have been.
Here is Felixstowe across the bay.
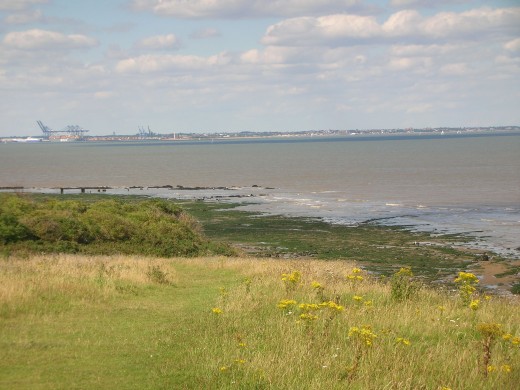
Looking back across the bay from near Felixstowe. The land is called 'the Naze'. The Naze shelters an area of saltmarsh and islands from the sea.
To the left of the picture is a famous local landmark - the Naze Tower built as an aide to shipping around 1720.
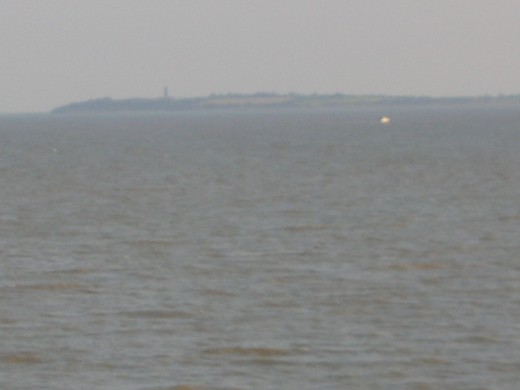
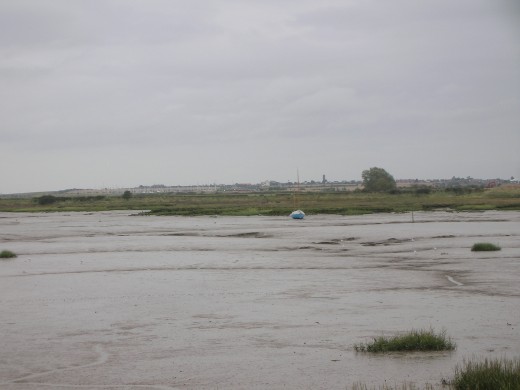
In the backwaters looking across mudflats and salt marsh to sea wall that EA want to breach. In the background is the Naze and Naze tower, just to the right of the dinghy's mast.
Here's a close up of some salt marsh most of which is in the process of being eroded away. But at the bottom right of the picture is a different type of vegetation, Spartina, which is thriving.
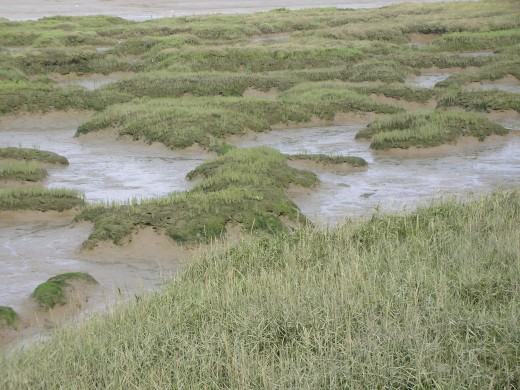
More Spartina, clumps of Spartina appear to be spontaneously, colonising the mud thus recreating the salt marsh. Which leads to the question
If the salt marsh is being recreated by nature, why flood farm land in an attempt to recreate salt marsh?

DEFRA 2006 Predictions Of Sea Level Rise
Time Period
| Annual Sea Level Rise
| Total Period Sea Level Rise
|
|---|---|---|
1990-2025
| 4mm/year
| 140mm
|
2025-2055
| 8mm/year
| 255mm
|
2055-2085
| 12mm/year
| 360mm
|
2085-2115
| 15mm/year
| 450mm
|
Total Rise 1990-2115
| 1205mm
|
DEFRA 2009 Predictions Of Sea Level Rise
Sea Level Rise From 1990 To
| High
| Medium
| Low
|
|---|---|---|---|
2000
| 35mm
| 30mm
| 25mm
|
2010
| 73mm
| 62mm
| 53mm
|
2020
| 115mm
| 92mm
| 82mm
|
2030
| 160mm
| 135mm
| 114mm
|
2040
| 208mm
| 175mm
| 148mm
|
2050
| 258mm
| 218mm
| 184mm
|
2060
| 314mm
| 263mm
| 222mm
|
2070
| 372mm
| 312mm
| 263mm
|
2080
| 433mm
| 363mm
| 305mm
|
2090
| 497mm
| 416mm
| 350mm
|
2095
| 531mm
| 444mm
| 373mm
|
Observed Average Sea Level Rise - Data From www.psmsl.org
Felixstowe
| -0.2 mm/year
| |
Southend
| 1.2 mm/year
| |
Lowestoft
| 2.4 mm/year
|
So What Does It All Mean
All of the DEFRA predictions exceed the observations at the three sites shown for the "prediction period" 1990-2010, which indicates the predictions are not correct. Remember the SMP, the plan to protect the environment by breaching sea walls is based on the earlier higher DEFRA 2006 predictions.
There is a catch, salt marsh has to be about the level of high water on spring tides. If the sedimentation rate, the rate at which mud is deposited on the salt marsh, is at least as great as the rate of sea level rise then the salt marsh will rise so that it stays above the sea. Apart from spring tides. If the rate of sea level rise is greater than than the sedimentation rate then the salt marsh will spend longer periods submerged and start to die.
The nearest study of sedimentation is at Tollesbury and indicates about 9mm/year. This means that from about 2055, the salt marsh will start to die out. So there isn't a lot of point in flooding fields to create salt marsh that will die in 40 years or so.
On the other hand if sea levels are not as high as the DEFRA 2006 predictions, particularly if they stay at the observed levels there will be no need for the project.
What About The Naze Tower
The Naze has been eroding at about a rate of 1.8 meters a year. Yes nearly 8 feet!
The cliffs had eroded so much that there was a strong chance the Naze tower would fall in the sea. At last some a rock wall was built at the base of the cliff to stop the sea erosion near the tower.
BUT
The rest of the Naze has been left unprotected. English Nature (yet another body) that is responsible for the cliffs wants to leave them unprotected as various rare animals live in holes in the cliffs. What happens to these rare species when the cliffs slide into the sea isn't specified.
So eventually, in a few hundred years, the northern end of the Naze will be totally destroyed and the sea will flood into backwaters, which won't help the salt marsh at all.
And The Cost
Around £1 million for the project at Kirby le Soken.
A freedom of information request to EA revealed they have spent about £300,000.
Natural England have agreed around £600,000 compensation to the farmer whose land will be flooded.
This excludes the cost of a 2 day public inquiry in 2010. A barrister, a solicitor for two days plus any preparation will not be cheap.
Of course there is another cost. The fields that are planned to be flooded have not been farmed for a number of years. A fresh water habitat has established itself in the fields, which includes a number of rare plants and birds. This will be lost if the fields are flooded with sea water.
£1million may not seem much. But these schemes are going on all around the UK and the total cost has been estimated at over £2 billion.
What do you think?


