Response To Comments On "Did Tax Cuts Spur Growth?"
Was Clinton's Deficit Surplus Real or Imaginary?
Kevin also took me to task on the reality of the claim that Clinton's tax hike and spending cut program, and the resulting increase in federal revenues and economic growth, really created a budget surplus and reduced the national debt. Kevin emphatically believes it did not. In part, he may be right, but in large part, I didn't think so and wasn't nearly as sure of my position. What follows then is my analysis.
There are basically two parts to the annual federal budget, on-budget and off-budget. This I have known for a long time. What I wasn't aware of, until this week and the Debt Reduction Panel recommendations, was the size of the off-budget numbers ... some $1.4 Trillion!! WoW!. As impressive as that number is though, if it doesn't change, up or down, it doesn't affect my analysis because it is the change we are considering.
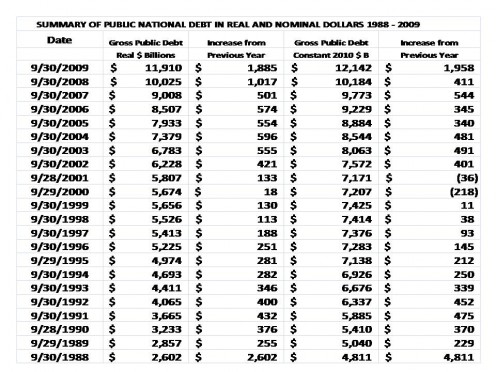
It is the on-budget numbers that we hear about all of the time, those are the Appropriated dollars, apparently the smaller of the two parts. In any event the first thing to look at is the total of the on- and off-budget outlays. The chart below presents the total picture. It offers a view of the Public Debt in two ways; in "Real" dollars and in "Nominal" dollars.
"Real" dollars represent the actual number of "greenbacks" owed. It is the accumulation of all monies borrowed and paid back since the Public Debt was last at a zero balance. "Nominal" dollars, on the other hand, represent the true value of those real dollars in terms of some base year, in this case 2010.
Nominal dollars is often a hard concept to understand; it took me quite awhile to actually "get it" even though it was critical to my job with the Air Force. For a time, I just did the calculations by rote and just trusting the theory was correct. In time, the logic finally sunk in.
It goes something like this: Would you rather be a millionaire today or 20 years ago? Most people answer they would rather be a millionaire 20 years ago. Why? Because a million dollars bought a lot more 20 years ago than it does today. Can you imagine anybody arguing that a $250,000 income wouldn't be super rich back in 1950? Well, the same idea works with the National Debt. I trillion dollar debt in 1980 was a huge deal, not so much today. So, with that in mind, let's look at the chart.
First consider the 3rd column labeled "increase from previous year" where the increase is between annual debt amounts expressed in Real dollars. Here, Kevin is absolutely right, the National Debt never stops increasing. I draw your attention, however, to the period between 1998 and 2001. Do you see how fast the increase in debt was decelerating? It increased only $18 billion in terms of Real dollars in 2000! This isn't a bad feat in and of itself, don't you think? What happened in 2000 to stop the deceleration? The Tech Boom bubble busted!
Now consider the 5th column. Here the increases in the Debt are in terms of Nominal dollars and it is in this view, where we look at the true value of the dollars, in terms of 2010 dollars, that we see a Decrease in the National Debt; at least for 2000 and 2001. The VALUE of the National Debt decreased in 2000 when compared to 1999 and the VALUE of the National Debt decreased in 2001 when compared to 2000. The debt may not have decreased in the actual number of dollar bills owed but it did decrease in what those dollar bills were actually worth, which, from an economic point of view meaning its economic impact, is the more important number. Furthermore, for the three years prior to that the debt did not increase very much at all, in nominal terms.
Real and Nominal dollars affects another point that Kevin correctly makes. The Debt did grow $1.4 trillion on Clinton's watch; in Real dollars. In 2001, the debt was $5.8T and in 1993, it was $4.4T. But the problem with comparing the 2001 $5.8T to the 1993 $4.4T is the same problem you have in comparing the millionaires I refereed to earlier. In order to put any meaning into the comparison, you have to do some arithmetic and convert each of those dollars into a constant dollar. In our case, it is a 2010 constant dollar. When you do that, Kevin still has a valid point, the Debt increased on Clinton's watch, it just isn't nearly as impressive a number. If you subtract the appropriate numbers from the chart below, you get an increase of $0.5T I believe. If the Tech bust had happened in 2001, I suspect we would have seen an actual decrease in the National Debt in terms of 2010 constant dollars. The budget surplus was just gaining momentum when it got stopped in its tracks.
I must note here that most politicians look at debt numbers in Real, non-comparative terms while most economists look at these same numbers in Nominal,constant dollar terms because that is the only way you can compare one year to another.
So far, we have been talking about the debt, which is what Kevin was referring to. But when we look at the "Deficit" we are talking on-budget, Appropriated outlays vs Federal income. In this case, I don't believe anybody disagrees that income exceeded appropriated outlays, which is the standard measure of a "surplus", during the final years of Clinton's administration. What will always be disputed was the cause. The stated purpose of President Clinton's fiscal program tax hikes and budget cuts was to achieve exactly that objective. It seems to me he did.
In terms of National Debt, I would argue as a professional Cost Analyst of which economic analysis is a major part of the job description, he achieved the goal of lowering it as well, if only briefly.
(The composition of the federal receipts are: Income taxes, corporate taxes, social security and railroad retirement taxes, excise taxes, and other. The "Other" is made up of estate taxes, gift taxes, custom duties, and employer portions of social security/railroad retirement, worker's compensation and unemployment insurance. (see sand chart below) Income from purchase of Treasury Bonds is not included)
NASDAQ COMPOSITE: 1983 - 1987

REAL AND NOMINAL NATIONAL DEBT

TOTAL TAX RECEIPTS AS A PERCENTAGE OF GDP


When Did The Clinton Good Times End
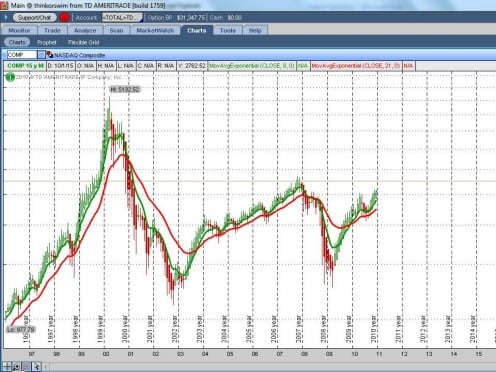
A comment on another hub I wrote on the Reagan Recession of 1981 from American Romance suggested that the stock market crashed about eight months before President George W. Bush took office. Because the chart I am going to provide is a follow-on to the ones I showed above, I told him I would answer his comment here.
I provide this stock chart for reference. It appears it was even before that; about November 1999 is when the downturn appears to be firmly established. The chart you are looking at is of the NASDAQ Composite Index and is heavily weighted by the Tech Industry.
What I find interesting about this chart is that the bottom of this crash is below that of the crash of 2008! Blew me away. The other stock indices, the DOW and S&P 500 are significantly the other way around.
If I did, I didn't mean to, but I don't think I was implying that President Bush 2's fiscal policy killed the Clinton historic boom period. I lay that at the feet of greed and speculation. I lay other maladies that followed at the feet of Bush 2's fiscal and war policies, but I will leave that for other hubs.
© 2010 Scott Belford


