- HubPages»
- Sports and Recreation»
- Team Sports»
- American Football»
- NFL Football
AFL/NFL 3,000 Yard Passers State by State Rank and Overview: Installment 1

References
In compiling this data the author used NFL.com, Profootballreference.com, and Wikipedia for research.
If you encounter any information you believe to be flawed, the author would appreciate your feedback.
Deciding a statistic to measure the impact of states from the quarterback position is a harder proposition than say running back or receiver because there are so many factors that determine whether or not a QB had a good season.
For example, the passing game has evolved so much over the years that what constitutes a good season has changed dramatically. Where once a signal caller completing just over 50% of his passes and throwing a few more touchdowns than interceptions would likely be considered an All-Pro, in today’s NFL climate it will lose you your job.
There are also offensive styles to consider. For some teams the perfect QB needs to throw for 2,500 yards or more and 15 touchdowns a season, manage the game well, and hand the ball off a lot. In other offensive schemes the quarterback needs to throw for 4,000 plus yards and 30 touchdowns or more a season to be considered effective.
That all said, in determining the most effective state for production of field generals, the 3,000 yard passing season has been decided upon as the mark. Although admittedly flawed, (You will see many players on this list who had poor seasons overall, and many deserving names will not be on this list because they played in an era before the forward pass was well evolved.) the overall product is an effective benchmark as to what states produce quality quarterbacks on a consistent basis.
Over the years the 3,000 yard passing season has been achieved or surpassed 530 times by 149 individuals. Of these 149 individuals, 3 were born in Washington, DC or outside of the U.S. In the following database and subsequent links, you will see detailed statistical analysis of each player to achieve 3,000 or more yards passing in a season.
How This Database is Structured
If this is you first visit to state by state football production rankings presented by Larry Rankin, then welcome and here is the format. Statistics are compiled by birth state. The table below has an overview of each state’s production of 3,000 yard passers. There are two ranking systems. To the right of the table you will have a ranking of each state by the overall number of performances, in this case 3,000 yard passing seasons.
To the left you will see a per capita ranking of states producing 3,000 yard passers. You will also see a per capita score. This score is determined by dividing the overall number of performances by said state’s current population. Then all the decimal places before the number are removed for a more visually digestible number.
The remainder of this installment will give detailed statistical analysis of every passer to meet or surpass the 3,000 yard passing mark for states 1-5 in per capita score. The remaining installments will give the same detailed analysis for all other states to qualify with a 3,000 yard passer as well as 3,000 yard passers for Washington, DC and non-U.S. regions.
Links to other installments are located in the text box in the upper right-hand corner and at the end of this installment. Links to other football production rankings can be found by clicking on the Larry Rankin profile in the upper right-hand corner of this page or via links at the end of this installment.
Overview: State Rankings for Production of 3,000 Yard Passers
Per Capita Rank
| Per Capita Score
| Performances Rank
| No. Performances
|
|---|---|---|---|
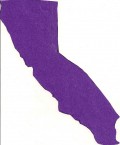
1. Mississippi
| 970
| 1. California
| 99
|
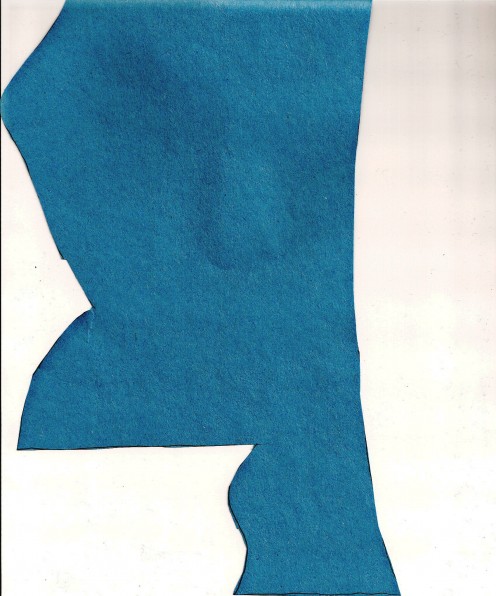
2. Louisiana
| 951
| 2. Pennsylvania
| 67
|
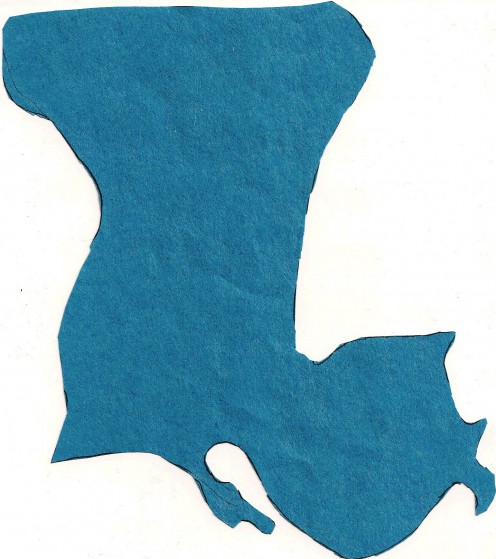
3. Iowa
| 582
| 3. Louisiana
| 44
|
4. Pennsylvania
| 525
| 4. Washington
| 32
|
5. Washington
| 459
| t5. Mississippi
| 29
|
6. Kansas
| 449
| t5. Texas
| 29
|
7. Alabama
| 290
| 7. New York
| 23
|
8. Utah
| 276
| t8. Iowa
| 18
|
9. California
| 258
| t8. Ohio
| 18
|
10. Idaho
| 248
| 10. Alabama
| 14
|
11. Kentucky
| 159
| t11. Florida
| 13
|
12. Ohio
| 156
| t11. Kansas
| 13
|
13. Oregon
| 153
| t13. Illinois
| 12
|
14. Indiana
| 152
| t13. New Jersey
| 12
|
15. Virginia
| 145
| t13. Virginia
| 12
|
16. Wisconsin
| 139
| 16. Indiana
| 10
|
17. New Jersey
| 135
| 17. Georgia
| 9
|
18. Massachusetts
| 120
| t18. Massachusetts
| 8
|
19. New York
| 117
| t18. Utah
| 8
|
20. Texas
| 110
| t18. Wisconsin
| 8
|
21. Arizona
| 106
| t21. Arizona
| 7
|
22. Illinois
| 93
| t21. Kentucky
| 7
|
23. Georgia
| 90
| t23. North Carolina
| 6
|
24. Oklahoma
| 78
| t23. Oregon
| 6
|
25. Florida
| 66
| t25. Idaho
| 4
|
26. Tennessee
| 62
| t25. Tennessee
| 4
|
27. North Carolina
| 61
| t27. Michigan
| 3
|
28. Missouri
| 50
| t27. Missouri
| 3
|
29. Maryland
| 34
| t27. Oklahoma
| 3
|
30. Michigan
| 30
| 30. Maryland
| 2
|
-- Washington, DC
| N/A
| -- Washington, DC
| 2
|
-- Canada
| N/A
| -- Canada
| 3
|
-- Japan
| N/A
| -- Japan
| 2
|
1. Mississippi
Per Capita Score: 970
3,000 Yard Passing Performances: 29
Coming first in per capita score is Mississippi. It seems they are in the top 2 or 3 of every per capita list. With a combination of wonderful athletes and a sparse population, pound for pound, their production of NFL elite is truly awesome.
Obviously the biggest name here is Brett Favre. He passed for over 3,000 yards in a seemingly inconceivable 18 straight seasons. For the time being he also holds the record for lifetime passing yards and touchdowns, though it seems he will eventually be passed by Peyton Manning in both categories.
And speaking of Mannings, Archie Manning, father of Peyton and Eli, was born in Mississippi as well. Archie Manning is considered by many to be the greatest QB to never have a chance. He played professionally for most of his career with the woeful Saints, and despite his talent, was never able to overcome the physical inferiority of the rest of his team.
Mississippi 3,000 Yard Passing Performances
Year/Team
| Name
| Yds
| Cmp
| Att
| Cmp%
| TD
| Int
| Rtng
|
|---|---|---|---|---|---|---|---|---|
1995 GB Pack
| Brett Favre
| 4,413
| 359
| 570
| 63.0
| 38
| 13
| 99.5
|
1998 GB Pack
| Brett Favre
| 4,212
| 347
| 551
| 63.0
| 31
| 23
| 87.8
|
2009 Min Vik
| Brett Favre
| 4,202
| 363
| 531
| 68.4
| 33
| 7
| 107.2
|
2007 GB Pack
| Brett Favre
| 4,155
| 356
| 535
| 66.5
| 28
| 15
| 95.7
|
1999 GB Pack
| Brett Favre
| 4,091
| 341
| 595
| 57.3
| 22
| 23
| 74.7
|
2004 GB Pack
| Brett Favre
| 4,088
| 346
| 541
| 64.1
| 30
| 17
| 92.4
|
2001 GB Pack
| Brett Favre
| 3,921
| 314
| 510
| 61.6
| 32
| 15
| 94.1
|
1996 GB Pack
| Brett Favre
| 3,899
| 325
| 543
| 59.9
| 39
| 13
| 95.8
|
2006 GB Pack
| Brett Favre
| 3,885
| 343
| 613
| 56.0
| 18
| 18
| 72.7
|
1994 GB Pack
| Brett Favre
| 3,882
| 363
| 582
| 62.4
| 33
| 14
| 90.7
|
2005 GB Pack
| Brett Favre
| 3,881
| 372
| 607
| 61.3
| 20
| 29
| 70.9
|
1997 GB Pack
| Brett Favre
| 3,867
| 304
| 513
| 59.3
| 35
| 16
| 92.6
|
2000 GB Pack
| Brett Favre
| 3,812
| 338
| 580
| 58.3
| 20
| 16
| 78.0
|
1980 NO Saints
| Archie Manning
| 3,716
| 309
| 509
| 60.7
| 23
| 20
| 81.8
|
2002 GB Pack
| Brett Favre
| 3,658
| 341
| 551
| 61.9
| 27
| 16
| 85.6
|
2009 Was Rdskn
| Jason Campbell
| 3,618
| 327
| 507
| 64.5
| 20
| 15
| 86.4
|
2008 NY Jets
| Brett Favre
| 3,472
| 343
| 522
| 65.7
| 22
| 22
| 81.0
|
1978 NO Saints
| Archie Manning
| 3,416
| 291
| 471
| 61.8
| 17
| 16
| 81.7
|
2002 Ten Ttn
| Steve McNair
| 3,387
| 301
| 492
| 61.2
| 22
| 15
| 84.0
|
2003 GB Pack
| Brett Favre
| 3,361
| 308
| 471
| 65.4
| 32
| 21
| 90.4
|
2001 Ten Ttn
| Steve McNair
| 3,350
| 264
| 431
| 61.3
| 21
| 12
| 90.2
|
1993 GB Pack
| Brett Favre
| 3,303
| 318
| 522
| 60.9
| 19
| 24
| 72.2
|
2008 Was Rdskn
| Jason Campbell
| 3,245
| 315
| 506
| 62.3
| 13
| 6
| 84.3
|
1998 Ten Oil
| Steve McNair
| 3,228
| 289
| 492
| 58.7
| 15
| 10
| 80.1
|
1992 GB Pack
| Brett Favre
| 3,227
| 302
| 471
| 64.1
| 18
| 13
| 85.3
|
2003 Ten Ttn
| Steve McNair
| 3,215
| 250
| 400
| 62.5
| 24
| 7
| 100.4
|
1979 NO Saints
| Archie Manning
| 3,169
| 252
| 420
| 60.0
| 15
| 20
| 75.6
|
2005 Ten Ttn
| Steve McNair
| 3,161
| 292
| 476
| 61.3
| 16
| 11
| 82.4
|
2006 Bal Rav
| Steve McNair
| 3,050
| 295
| 468
| 63.0
| 16
| 12
| 82.5
|
2. Louisiana
Per Capita Score: 951
3,000 Yard Passing Performances: 44
Thus far there are two states that have shone brighter than any of the rest in our per capita rankings: Louisiana and Mississippi. Coming in just a few points behind Mississippi this time is Louisiana.
And if it hadn’t been for Archie Manning’s relocation from his birth state of Mississippi to Louisiana, the story for QB rankings would be much different. Archie’s sons Peyton and Eli are the main statistical contributors for the state of Louisiana.
Of the brothers Peyton has had the largest statistical impact in his career. His 5,477 yards passing in 2013 is the all-time record for yards in a season, as are the 55 touchdowns he had that same year. Barring injury, he should surpass Brett Favre in lifetime touchdowns sometime this season and all-time passing yards at some point in the 2015 season.
Though Peyton may not surpass Favre in lifetime 3,000 yard passing seasons, his 13 career 4,000 yard passing seasons is a record likely to stand the test of time.
Between Peyton and Eli there are 3 Super Bowl victories, but there is another name on this list with more championships than all Mannings combined. Though Terry Bradshaw played in a different era than the Manning brothers and his statistics reflect this, he guided the Pittsburgh Steelers to 4 Super Bowl Victories.
Louisiana 3,000 Yard Passing Performances
Year/Team
| Name
| Yds
| Cmp
| Att
| Cmp%
| TD
| Int
| Rtng
|
|---|---|---|---|---|---|---|---|---|
2013 Den Bronc
| Peyton Manning
| 5,477
| 450
| 659
| 68.3
| 55
| 10
| 115.1
|
2011 NY Gia
| Eli Manning
| 4,933
| 359
| 589
| 61.0
| 29
| 16
| 92.9
|
2010 Ind Colts
| Peyton Manning
| 4,700
| 450
| 679
| 66.3
| 33
| 17
| 91.9
|
2012 Den Bronc
| Peyton Manning
| 4,659
| 400
| 583
| 68.6
| 37
| 11
| 105.8
|
2004 Ind Colts
| Peyton Manning
| 4,557
| 336
| 497
| 67.6
| 49
| 10
| 121.1
|
2009 Ind Colts
| Peyton Manning
| 4,500
| 393
| 571
| 68.8
| 33
| 16
| 99.9
|
2000 Ind Colts
| Peyton Manning
| 4,413
| 357
| 571
| 62.5
| 33
| 15
| 94.7
|
2006 Ind Colts
| Peyton Manning
| 4,397
| 362
| 557
| 65.0
| 31
| 9
| 101.0
|
2003 Ind Colts
| Peyton Manning
| 4,267
| 379
| 566
| 67.0
| 29
| 10
| 99.0
|
2002 Ind Colts
| Peyton Manning
| 4,200
| 392
| 591
| 66.3
| 27
| 19
| 88.8
|
1999 Ind Colts
| Peyton Manning
| 4,135
| 331
| 533
| 62.1
| 26
| 15
| 90.7
|
2001 Ind Colts
| Peyton Manning
| 4,131
| 343
| 547
| 62.7
| 26
| 23
| 84.1
|
2007 Ind Colts
| Peyton Manning
| 4,040
| 337
| 515
| 65.4
| 31
| 14
| 98.0
|
2009 NY Gia
| Eli Manning
| 4,021
| 317
| 509
| 62.3
| 27
| 14
| 93.1
|
2010 NY Gia
| Eli Manning
| 4,002
| 339
| 539
| 62.9
| 31
| 25
| 85.3
|
2008 Ind Colts
| Peyton Manning
| 4,002
| 371
| 555
| 66.8
| 27
| 12
| 95.0
|
2012 NY Giants
| Eli Manning
| 3,948
| 321
| 536
| 59.9
| 26
| 15
| 87.2
|
2004 Car Pan
| Jake Delhomme
| 3,886
| 310
| 533
| 58.2
| 29
| 15
| 87.3
|
2013 NY Gia
| Eli Manning
| 3,818
| 317
| 551
| 57.5
| 18
| 27
| 69.4
|
2005 NY Gia
| Eli Manning
| 3,762
| 294
| 557
| 52.8
| 24
| 17
| 75.9
|
2005 Ind Colts
| Peyton Manning
| 3,747
| 305
| 453
| 67.3
| 28
| 10
| 104.1
|
1998 Ind Colts
| Peyton Manning
| 3,739
| 326
| 575
| 56.7
| 26
| 28
| 71.2
|
1979 Pit Steel
| Terry Bradshaw
| 3,724
| 259
| 472
| 54.9
| 26
| 25
| 77.0
|
1981 TB Bucs
| Doug Williams
| 3,563
| 238
| 471
| 50.5
| 19
| 14
| 76.8
|
2005 Car Pan
| Jake Delhomme
| 3,421
| 262
| 435
| 60.2
| 24
| 16
| 88.1
|
2003 Pit Steel
| Tommy Maddox
| 3,414
| 298
| 519
| 57.4
| 18
| 17
| 75.3
|
1980 TB Bucs
| Doug Williams
| 3,396
| 254
| 521
| 48.8
| 20
| 16
| 69.9
|
1995 SD Chrg
| Stan Humphries
| 3,381
| 282
| 478
| 59.0
| 17
| 14
| 80.4
|
1992 SD Chrg
| Stan Humphries
| 3,356
| 263
| 454
| 57.9
| 16
| 18
| 76.4
|
1980 Pit Steel
| Terry Bradshaw
| 3,339
| 218
| 424
| 51.4
| 24
| 22
| 75.0
|
2007 NY Gia
| Eli Manning
| 3,336
| 297
| 529
| 56.1
| 23
| 20
| 73.9
|
2008 Car Pan
| Jake Delhomme
| 3,288
| 246
| 414
| 59.4
| 15
| 12
| 84.7
|
1992 NO Saints
| Bobby Hebert
| 3,287
| 249
| 422
| 59.0
| 19
| 16
| 82.9
|
2006 NY Gia
| Eli Manning
| 3,244
| 301
| 522
| 57.7
| 24
| 18
| 77.0
|
2008 NY Gia
| Eli Manning
| 3,238
| 289
| 479
| 60.3
| 21
| 10
| 86.4
|
2003 Car Pan
| Jake Delhomme
| 3,219
| 266
| 449
| 59.2
| 19
| 16
| 80.6
|
1994 SD Chrg
| Stan Humphries
| 3,209
| 264
| 453
| 58.3
| 17
| 12
| 81.6
|
1988 NO Saints
| Bobby Hebert
| 3,156
| 280
| 478
| 58.6
| 20
| 15
| 79.3
|
1996 Atl Fal
| Bobby Hebert
| 3,152
| 294
| 488
| 60.2
| 22
| 25
| 72.9
|
1980 Bal Colts
| Bert Jones
| 3,134
| 248
| 446
| 55.6
| 23
| 21
| 75.3
|
2001 Pit Steel
| Kordell Stewart
| 3,109
| 266
| 442
| 60.2
| 14
| 11
| 81.7
|
1976 Bal Colts
| Bert Jones
| 3,104
| 207
| 343
| 60.3
| 24
| 9
| 102.5
|
1981 Bal Colts
| Bert Jones
| 3,094
| 244
| 426
| 57.3
| 21
| 20
| 76.9
|
1997 Pit Steel
| Kordell Stewart
| 3,020
| 236
| 440
| 53.6
| 21
| 17
| 75.2
|
3. Iowa
Per Capita Score: 582
3,000 Yard Passing Performances: 18
Coming in at third is Iowa. Though there are a number of recognizable names on this list, Kurt Warner stands above all others. His performances with the Rams during “the greatest show on turf” era were statistically awesome.
Also with Warner we have one of the most amazing NFL stories. Before being picked up by the Rams, he was playing Arena League football and bagging groceries for a supermarket in the offseason. At the end of Warner’s stay with the Rams, he had two Super Bowl appearances and one victory.
Then Warner’s career fell off yet again before his final resurgence, which led to a Super Bowl loss with the Arizona Cardinals.
Dubious Distinction: Hugh Millen’s 9 touchdown passes in 1991 for the Patriots are the fewest ever for a QB finishing a season with over 3,000 yards passing.
Iowa 3,000 Yard Passing Performances
Year/Team
| Name
| Yds
| Cmp
| Att
| Cmp%
| TD
| Int
| Rtng
|
|---|---|---|---|---|---|---|---|---|
2001 Stl Ram
| Kurt Warner
| 4,830
| 375
| 546
| 68.7
| 36
| 22
| 101.4
|
2004 KC Chief
| Trent Green
| 4,591
| 369
| 556
| 66.4
| 27
| 17
| 95.2
|
2008 Ari Cards
| Kurt Warner
| 4,583
| 401
| 598
| 67.1
| 30
| 14
| 96.9
|
1999 Stl Rams
| Kurt Warner
| 4,353
| 325
| 499
| 65.1
| 41
| 13
| 109.2
|
2003 KC Chief
| Trent Green
| 4,039
| 330
| 523
| 63.1
| 24
| 12
| 92.6
|
2005 KC Chief
| Trent Green
| 4,014
| 317
| 507
| 62.5
| 17
| 10
| 90.1
|
1981 Atl Fal
| Steve Bartkowski
| 3,829
| 297
| 533
| 55.7
| 30
| 23
| 79.2
|
2009 Den Bronc
| Kyle Orton
| 3,802
| 336
| 541
| 62.1
| 21
| 12
| 86.8
|
2001 KC Chiefs
| Trent Green
| 3,783
| 296
| 523
| 56.6
| 17
| 24
| 71.1
|
2009 Ari Cards
| Kurt Warner
| 3,753
| 281
| 451
| 62.3
| 27
| 17
| 89.8
|
2002 KC Chief
| Trent Green
| 3,690
| 287
| 470
| 61.1
| 26
| 13
| 92.6
|
2010 Den Bronc
| Kyle Orton
| 3,653
| 293
| 498
| 58.8
| 20
| 9
| 87.5
|
1980 Atl Falcons
| Steve Bartkowski
| 3,544
| 257
| 463
| 55.6
| 31
| 16
| 88.2
|
1998 Was Rdskn
| Trent Green
| 3,441
| 278
| 509
| 54.6
| 23
| 11
| 81.8
|
2000 Stl Rams
| Kurt Warner
| 3,429
| 235
| 347
| 67.7
| 21
| 18
| 98.3
|
2007 Ari Cards
| Kurt Warner
| 3,417
| 281
| 451
| 62.3
| 27
| 17
| 89.8
|
1983 Atl Fal
| Steve Bartkowski
| 3,167
| 274
| 432
| 63.4
| 22
| 5
| 97.6
|
1991 NE Pats
| Hugh Millen
| 3,073
| 246
| 409
| 60.1
| 9
| 18
| 72.5
|
4. Pennsylvania
Per Capita Score: 525
3,000 Yard Passing Performances: 67
Pennsylvania has produced some of the most revolutionary players in the history of the quarterback position. Though it is difficult to summarize how much the state of Pennsylvania has done to shape the quarterback position, here are just a few of the milestones.
Johnny Unitas was among the first 3 players to crack the 3,000 yard passing season in 1960. His 3,099 yards was tops among the 3. In 1967 Joe Namath became the first player to ever pass for over 4,000 yards in a season, and in 1984 Dan Marino became the first ever to pass for over 5,000 yards in a season.
George Blanda played an NFL record 26 seasons. From 1990-1993 Jim Kelly guided the Bills to an NFL record 4 straight Super Bowls, though he would lose all four, and Joe Montana has most every Super Bowl passing efficiency record, 3 Super Bowl MVPs, and 4 Super Bowl rings.
Dubious Distinction: Though he didn’t quite throw for 3,000 yards that year, George Blanda threw an NFL record 42 interceptions in 1962.
Pennsylvania 3,000 Yard Passing Performances
Year/Team
| Name
| Yds
| Cmp
| Att
| Cmp%
| TD
| Int
| Rtng
|
|---|---|---|---|---|---|---|---|---|
1984 Mia Dlph
| Dan Marino
| 5,084
| 362
| 564
| 64.2
| 48
| 17
| 108.9
|
2009 Hou Tex
| Matt Schaub
| 4,770
| 396
| 583
| 67.9
| 29
| 15
| 98.6
|
1986 Mia Dlph
| Dan Marino
| 4,746
| 378
| 623
| 60.7
| 44
| 23
| 92.5
|
2012 Atl Fal
| Matt Ryan
| 4,719
| 422
| 615
| 68.6
| 32
| 14
| 99.1
|
2002 Oak Rai
| Rich Gannon
| 4,689
| 418
| 618
| 67.6
| 26
| 10
| 97.3
|
2013 Atl Fal
| Matt Ryan
| 4,515
| 439
| 651
| 67.4
| 26
| 17
| 89.6
|
1994 Mia Dlph
| Dan Marino
| 4,453
| 385
| 615
| 62.6
| 30
| 17
| 89.2
|
1988 Mia Dlph
| Dan Marino
| 4,434
| 354
| 606
| 58.4
| 28
| 23
| 80.8
|
2010 Hou Tex
| Matt Schaub
| 4,370
| 365
| 574
| 63.6
| 24
| 12
| 92.0
|
2006 Stl Rams
| Marc Bulger
| 4,301
| 370
| 588
| 62.9
| 24
| 8
| 92.9
|
2011 Atl Fal
| Matt Ryan
| 4,177
| 347
| 566
| 61.3
| 29
| 12
| 92.2
|
1985 Mia Dlph
| Dan Marino
| 4,137
| 336
| 567
| 59.3
| 30
| 21
| 84.1
|
1992 Mia Dlph
| Dan Marino
| 4,116
| 330
| 554
| 59.6
| 24
| 16
| 85.1
|
2002 NY Gia
| Kerry Collins
| 4,073
| 335
| 545
| 61.5
| 19
| 14
| 85.4
|
2012 Hou Tex
| Matt Schaub
| 4,008
| 350
| 544
| 64.3
| 22
| 12
| 90.7
|
1967 NY Jets
| Joe Namath
| 4,007
| 258
| 491
| 52.5
| 26
| 28
| 73.8
|
1989 Mia Dlph
| Dan Marino
| 3,997
| 308
| 550
| 56.0
| 24
| 22
| 76.9
|
1991 Mia Dlph
| Dan Marino
| 3,970
| 318
| 549
| 57.9
| 25
| 13
| 85.8
|
2004 Stl Ram
| Marc Bulger
| 3,964
| 321
| 485
| 66.2
| 21
| 14
| 93.7
|
1990 SF 49ers
| Joe Montana
| 3,944
| 321
| 520
| 61.7
| 26
| 16
| 89.0
|
1983 SF 49ers
| Joe Montana
| 3,910
| 332
| 515
| 64.5
| 26
| 12
| 94.6
|
2003 Stl Ram
| Marc Bulger
| 3,845
| 336
| 532
| 63.2
| 22
| 22
| 81.4
|
1991 Buf Bills
| Jim Kelly
| 3,844
| 304
| 474
| 64.1
| 33
| 17
| 97.6
|
1999 Oak Rai
| Rich Gannon
| 3,840
| 304
| 515
| 59.0
| 24
| 14
| 86.5
|
2001 Oak Rai
| Rich Gannon
| 3,828
| 361
| 549
| 65.8
| 27
| 9
| 95.5
|
1997 Mia Dlph
| Dan Marino
| 3,780
| 319
| 548
| 58.2
| 16
| 11
| 80.7
|
2002 NE Pats
| Kerry Collins
| 3,764
| 327
| 568
| 57.6
| 19
| 16
| 77.1
|
2005 Oak Rai
| Kerry Collins
| 3,759
| 302
| 565
| 53.5
| 20
| 12
| 77.3
|
2010 Atl Fal
| Matt Ryan
| 3,705
| 357
| 571
| 62.5
| 28
| 9
| 91.0
|
1995 Mia Dlph
| Dan Marino
| 3,668
| 309
| 482
| 64.1
| 24
| 10
| 90.8
|
1985 SF 49ers
| Joe Montana
| 3,653
| 303
| 494
| 61.3
| 27
| 13
| 91.3
|
1984 SF 49ers
| Joe Montana
| 3,630
| 279
| 432
| 64.6
| 28
| 10
| 102.9
|
2000 NY Giants
| Kerry Collins
| 3,610
| 311
| 529
| 58.8
| 22
| 13
| 83.1
|
1986 Buf Bills
| Jim Kelly
| 3,593
| 285
| 480
| 59.4
| 22
| 17
| 83.3
|
1981 SF 49ers
| Joe Montana
| 3,565
| 311
| 488
| 63.7
| 19
| 12
| 88.4
|
1990 Mia Dlph
| Dan Marino
| 3,563
| 306
| 531
| 57.6
| 21
| 11
| 82.6
|
1989 SF 49ers
| Joe Montana
| 3,521
| 271
| 386
| 70.2
| 26
| 8
| 112.4
|
1998 Mia Dlph
| Dan Marino
| 3,497
| 310
| 537
| 57.7
| 23
| 15
| 80.0
|
2004 Oak Rai
| Kerry Collins
| 3,495
| 289
| 513
| 56.3
| 21
| 20
| 74.8
|
1963 Bal Colts
| Johnny Unitas
| 3,481
| 237
| 410
| 57.8
| 20
| 12
| 89.7
|
1964 Bos Pats
| Babe Parilli
| 3,465
| 228
| 473
| 48.2
| 31
| 27
| 70.8
|
1992 Buf Bills
| Jim Kelly
| 3,457
| 269
| 462
| 58.2
| 23
| 19
| 81.2
|
1996 Was Rdskn
| Gus Frerotte
| 3,453
| 270
| 470
| 57.4
| 12
| 11
| 79.3
|
2008 Atl Fal
| Matt Ryan
| 3,440
| 265
| 434
| 61.1
| 16
| 11
| 87.7
|
2000 Oak Rai
| Rich Gannon
| 3,430
| 284
| 473
| 60.0
| 28
| 11
| 92.4
|
1967 Bal Colts
| Johnny Unitas
| 3,428
| 255
| 436
| 58.5
| 20
| 16
| 83.6
|
1993 Buf Bills
| Jim Kelly
| 3,382
| 288
| 470
| 61.3
| 18
| 18
| 79.9
|
1988 Buf Bills
| Jim Kelly
| 3,380
| 269
| 452
| 59.5
| 15
| 17
| 78.2
|
1966 NY Jets
| Joe Namath
| 3,379
| 232
| 471
| 49.3
| 19
| 27
| 62.6
|
1994 LA Rai
| Jeff Hostetler
| 3,334
| 263
| 455
| 57.8
| 20
| 16
| 80.8
|
1961 Hou Oil
| George Blanda
| 3,330
| 187
| 362
| 51.7
| 36
| 22
| 91.3
|
2010 Mia Dlph
| Chad Henne
| 3,301
| 301
| 490
| 61.4
| 15
| 19
| 75.4
|
1964 Hou Oil
| George Blanda
| 3,287
| 262
| 505
| 51.9
| 17
| 27
| 61.4
|
1994 KC Chief
| Joe Montana
| 3,283
| 299
| 493
| 60.6
| 16
| 9
| 83.6
|
1987 Mia Dlph
| Dan Marino
| 3,245
| 263
| 444
| 59.2
| 26
| 13
| 89.2
|
1993 LA Rai
| Jeff Hostetler
| 3,242
| 236
| 419
| 56.3
| 14
| 10
| 82.5
|
2013 Jax Jag
| Chad Henne
| 3,241
| 305
| 503
| 60.6
| 13
| 14
| 76.5
|
1968 NY Jets
| Joe Namath
| 3,147
| 187
| 380
| 49.2
| 15
| 17
| 72.1
|
1989 Buf Bills
| Jim Kelly
| 3,130
| 228
| 391
| 58.3
| 25
| 18
| 86.2
|
1995 Buf Bills
| Jim Kelly
| 3,130
| 255
| 458
| 55.7
| 22
| 13
| 81.1
|
1995 KC Chiefs
| Steve Bono
| 3,121
| 293
| 520
| 56.3
| 21
| 10
| 79.5
|
1994 Buf Bills
| Jim Kelly
| 3,114
| 285
| 448
| 63.6
| 22
| 17
| 84.6
|
2003 NY Gia
| Kerry Collins
| 3,110
| 284
| 500
| 56.8
| 13
| 16
| 70.7
|
1960 Bal Colts
| Johnny Unitas
| 3,099
| 190
| 378
| 50.3
| 25
| 24
| 73.7
|
1987 SF 49ers
| Joe Montana
| 3,054
| 266
| 398
| 66.8
| 31
| 13
| 102.1
|
2008 Hou Tex
| Matt Schaub
| 3,043
| 251
| 380
| 66.1
| 15
| 10
| 92.7
|
1963 Hou Oil
| George Blanda
| 3,003
| 224
| 423
| 53.0
| 24
| 25
| 70.1
|

5. Washington
Per Capita Score: 459
3,000 Yard Passing Performances: 32
The state of Washington has produced a number of good QBs, but the accomplishments of John Elway are by far the most impactful on NFL football. Though the Broncos’ offensive style was not as pass-orientated as others, Elway passed for over 3,000 yards on an impressive 12 occasions.
Elway had 5 Super Bowl appearances in his distinguished career, two in which he guided his team to victory. In addition, he was also a Super Bowl MVP.
Obscure Stats: Chris Chandler’s 327 pass attempts for the 1998 Atlanta Falcons are the fewest attempts a QB has finished a season with while breaking the 3,000 yard barrier.
Washington 3,000 Yard Passing Performances
Year/Team
| Name
| Yds
| Cmp
| Att
| Cmp%
| TD
| Int
| Rtng
|
|---|---|---|---|---|---|---|---|---|
1994 NE Pats
| Drew Bledsoe
| 4,555
| 400
| 691
| 57.9
| 25
| 27
| 73.6
|
2002 Buf Bills
| Drew Bledsoe
| 4,359
| 375
| 610
| 61.5
| 24
| 15
| 86.0
|
2006 Det Lions
| Jon Kitna
| 4,208
| 372
| 596
| 62.4
| 21
| 22
| 79.9
|
1996 NE Pats
| Drew Bledsoe
| 4,086
| 373
| 623
| 59.9
| 27
| 15
| 83.7
|
2007 Det Lions
| Jon Kitna
| 4,068
| 355
| 561
| 63.3
| 18
| 20
| 80.9
|
1993 Den Bronc
| John Elway
| 4,030
| 348
| 551
| 63.2
| 25
| 10
| 92.8
|
1999 NE Pats
| Drew Bledsoe
| 3,985
| 305
| 539
| 56.6
| 19
| 21
| 75.6
|
1995 Den Bronc
| John Elway
| 3,970
| 316
| 542
| 58.3
| 26
| 14
| 86.4
|
1985 Den Bronc
| John Elway
| 3,891
| 327
| 605
| 54.0
| 22
| 23
| 70.2
|
1997 NE Pats
| Drew Bledsoe
| 3,706
| 314
| 522
| 60.2
| 28
| 15
| 87.7
|
2005 Dal Cwby
| Drew Bledsoe
| 3,639
| 300
| 499
| 60.1
| 23
| 17
| 83.7
|
1997 Den Bronc
| John Elway
| 3,635
| 280
| 502
| 55.8
| 27
| 11
| 87.5
|
1998 NE Pats
| Drew Bledsoe
| 3,633
| 263
| 481
| 54.7
| 20
| 14
| 80.9
|
2003 Cin Beng
| Jon Kitna
| 3,591
| 324
| 520
| 62.3
| 26
| 15
| 87.4
|
1990 Den Bronc
| John Elway
| 3,526
| 294
| 502
| 58.6
| 15
| 14
| 78.5
|
1995 NE Pats
| Drew Bledsoe
| 3,507
| 323
| 636
| 50.8
| 13
| 16
| 63.7
|
1994 Den Bronc
| John Elway
| 3,490
| 307
| 494
| 62.1
| 16
| 10
| 85.7
|
1986 Den Bronc
| John Elway
| 3,485
| 280
| 504
| 55.6
| 19
| 13
| 79.0
|
1999 Sea Shwk
| Jon Kitna
| 3,346
| 270
| 495
| 54.5
| 23
| 16
| 77.7
|
1996 Den Bronc
| John Elway
| 3,328
| 287
| 466
| 61.6
| 26
| 14
| 89.2
|
2013 KC Chief
| Alex Smith
| 3,313
| 308
| 508
| 60.6
| 23
| 7
| 89.1
|
1988 Den Bronc
| John Elway
| 3,309
| 274
| 496
| 55.2
| 17
| 19
| 71.4
|
2000 NE Pats
| Drew Bledsoe
| 3,291
| 312
| 531
| 58.8
| 17
| 13
| 77.3
|
1991 Den Bronc
| John Elway
| 3,253
| 242
| 451
| 53.7
| 13
| 12
| 75.4
|
2001 Cin Beng
| Jon Kitna
| 3,216
| 313
| 581
| 53.9
| 12
| 22
| 61.1
|
1987 Den Bronc
| John Elway
| 3,198
| 224
| 410
| 54.6
| 19
| 12
| 83.4
|
2002 Cin Beng
| Jon Kitna
| 3,178
| 294
| 473
| 62.2
| 16
| 16
| 79.1
|
1998 Atl Fal
| Chris Chandler
| 3,154
| 190
| 327
| 58.1
| 25
| 12
| 100.9
|
2011 SF 49ers
| Alex Smith
| 3,144
| 273
| 445
| 61.3
| 17
| 5
| 90.7
|
1988 Dal Cwby
| Steve Pelluer
| 3,139
| 245
| 435
| 56.3
| 17
| 19
| 73.9
|
1990 Pho Cards
| Timm Rosenbach
| 3,098
| 237
| 437
| 54.2
| 16
| 17
| 72.8
|
1989 Den Bronc
| John Elway
| 3,051
| 223
| 416
| 53.6
| 18
| 18
| 73.7
|
© 2014 Larry Rankin
Related

AFL/NFL 3,000 Yard Passers State by State Rank: Installment 2

US States With Most NFL Hall of Famers

AFL/NFL 1,000 Yard Receivers State by State Rank and Overview: Installment 1

Top Five 2024 NFL Draft Prospects- Quarterback
AFL/NFL 1,000 Yard Rushers State by State Rank and Washington, DC and Non-U.S. born 1,000 Yard Rushers: Installment 4