Bode plots- Control Systems

Gain Plot- Answering Numericals
Bode plots is an easy topic.before we answer any question on Bode plot, we need to make certain initial arrangements on the graph paper. On the graph paper make the following arrangements:
- Mark X axis on the 6 th darkened line. Mark the x axis as ( ω ).
- Mark Y axis on the first vertical line ( Mark the y axis as gain in dB ).
- Mark the origin as 0 dB,then each horizontal darkened line above X axis as 20 dB, 40 dB , 60 dB and each horizontal darkened line below x axis as -20 dB, -40 dB and so on.
- mark 1 on the point where the first graph ends.
- then mark 10, 100, 1000 on the x axis
- Connect 20,40, 60, -20 ,-40,-60 to point 1 on the x axis by dotted lines.
- slope of these lines are -20 dB / dec, -40 dB/dec, -60 dB/dec, +20 db/dec,+40 dB/dec and +60 dB /dec respectively.
once the initial arrangements are made on the graph paper, to plot the Gain plot or magnitude plot we have to consider the question. say for example our question is
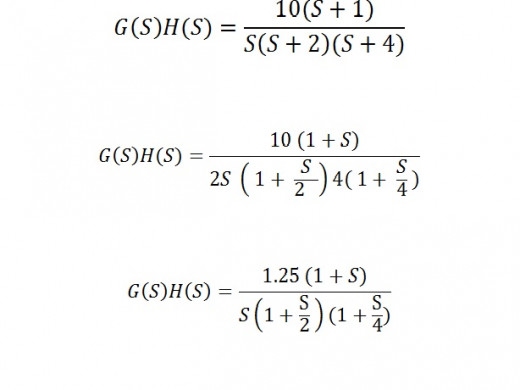

1. Convert G(s) H(s) into the standard form of ( 1+s) as shown in equations above
2. The lone term on the numerator is K. Check the type of the equation. For a type 1 equation , the initial slope is -20 dB/dec and ω = k
3. Here ω= 1.25 as its type 1 as shown in equation above.
4. Then take the reciprocals of coefficient of s in both numerator and denominator. Here (1/T), 1/ (1/2), 1/ (1/4) . Here 1, 2, and 4 are the reciprocals. These are the corner frequencies (CF).
5. Then draw a table of 4 columns for CF, term, slope and total slope
CORNER FREQUENCY
| TERM
| SLOPE
| TOTAL SLOPE
|
|---|---|---|---|
----
| 1/ S
| -20
| -20
|
1
| 1 + S
| 20
| 0
|
2
| 1/ ( 1+ 0.5S)
| -20
| -20
|
4
| 1/ ( 1+ 0.25 S)
| -20
| -40
|
6. Always add the corner frequencies in ascending order
7. in the column for " term", write the term that contributed for the corresponding corner frequency.
8. Then write the slopes, the initial slope is -20 for type 1 system, -40 for type 2 system and -60 for type 3 system.so in the column for slope in the first row, mark " -20" as the given example is a type 1 question.
9. If the term contains an S , S2 or S 3 in the numerator then put slope = +20, +40 or +60 in the column for "slope" respectively.
10. If the term contains an S , S2 or S 3 in the denominator then put slope = -20, -40 or -60 respectively.
11. Then fill the first total slope with the first slope valve
. here -20.
12. Then add this -20 to the next slope valve . i.e. -20+20= 0
13. Now add this value "0" to the next slope valve. here it is 0 +(-20) =-20
14. Similarly add -20 to the next slope valve to get -40 . here -20+ -20 =-40
15. To draw the magnitude plot,mark the gain on the x axis. then draw a line parallel to the first slope valve ( here -20)( we have already drawn dotted lines with slope -20, -40 and -60 while making the initial adjustments) till corner frequency 1. then draw another line from the previous line ending , parallel to x axis ( as slope = 0) till corner frequency 2. and then finally a line from the end of previous line till 4 and parallel to -20 .
This would give us Magnitude plot for Bode plot.


