Theory and Research in Psychology Statistics
In your own words, describe how statistics links theory with research. What conclusions can be drawn if statistical procedures are included in the research? What conclusions can be drawn if statistical procedures are not included in the research?
In the field of Statistic theory and research are both linked together. Theory is “an idea that is suggested or presented as possibly true but that is not known or proven to be true” (Merriam-Webster, 2014). Research is “the systematic investigation into and study of materials and sources in order to establish facts and reach new conclusions” (Oxford Dictionaries, 2014). Research is often based on a researcher, psychologist, or scientist attempting to prove or disprove a theory or theories through investigation. For example Professor Goldin-Meadow is currently attempting to prove her theory that gestures can play a role in learning through extensive research in the US and in Nicaragua. Her theory is that when children gesture while they are attempting to solve math problems they enter a transitional state that makes them ready to learn faster than children that do not gesture while learning.
Different types of conclusions are drawn from research depending on if statistical procedures are included in the research. If descriptive statistics and inferential statistics are used in the research study then the results of the study will be in a quantitative form. An example of a quantitative study would be if researchers where attempting to find out the percentage of teenagers who experience cyberbullying. If statistical procedures are not used in research then the result will be shown in a qualitative from. An example of a qualitative research study would be researchers attempting to determine why certain students are bullied while others are not.
References
Aron, A., Aron. E., Coups. E. (2014). Statistics for Psychology Pearson Education Inc.
2014.
Definition of research in English:. (n.d.). Oxford Dictionaries. Retrieved September 2, 2014, from http://www.oxforddictionaries.com/us/definition/american_english/research
Goldin-Meadow Laboratory . (n.d.). University of Chicago. Retrieved September 2, 2014, from http://goldin-meadow-lab.uchicago.edu/
Professor Goldin-Meadow . (n.d.). Department of Psychology: Faculty. Retrieved September 2, 2014, from http://psychology.uchicago.edu/people/faculty/sgmeadow.shtml
Theory. (n.d.). Merriam-Webster. Retrieved September 2, 2014, from http://www.merriam-webster.com/dictionary/theory?show=0&t=1409675510
Examine the options available that enable researchers to clearly report their results, such as graphic representations, tables, mathematical representations, and others. Choose three tools to assess. What interests you most about these tools? What are the advantages and disadvantages of each tool? Describe how the tool would assist you as a potential researcher in conducting statistical procedures. What tools do you feel comfortable with? What tools might be intimidating for you?
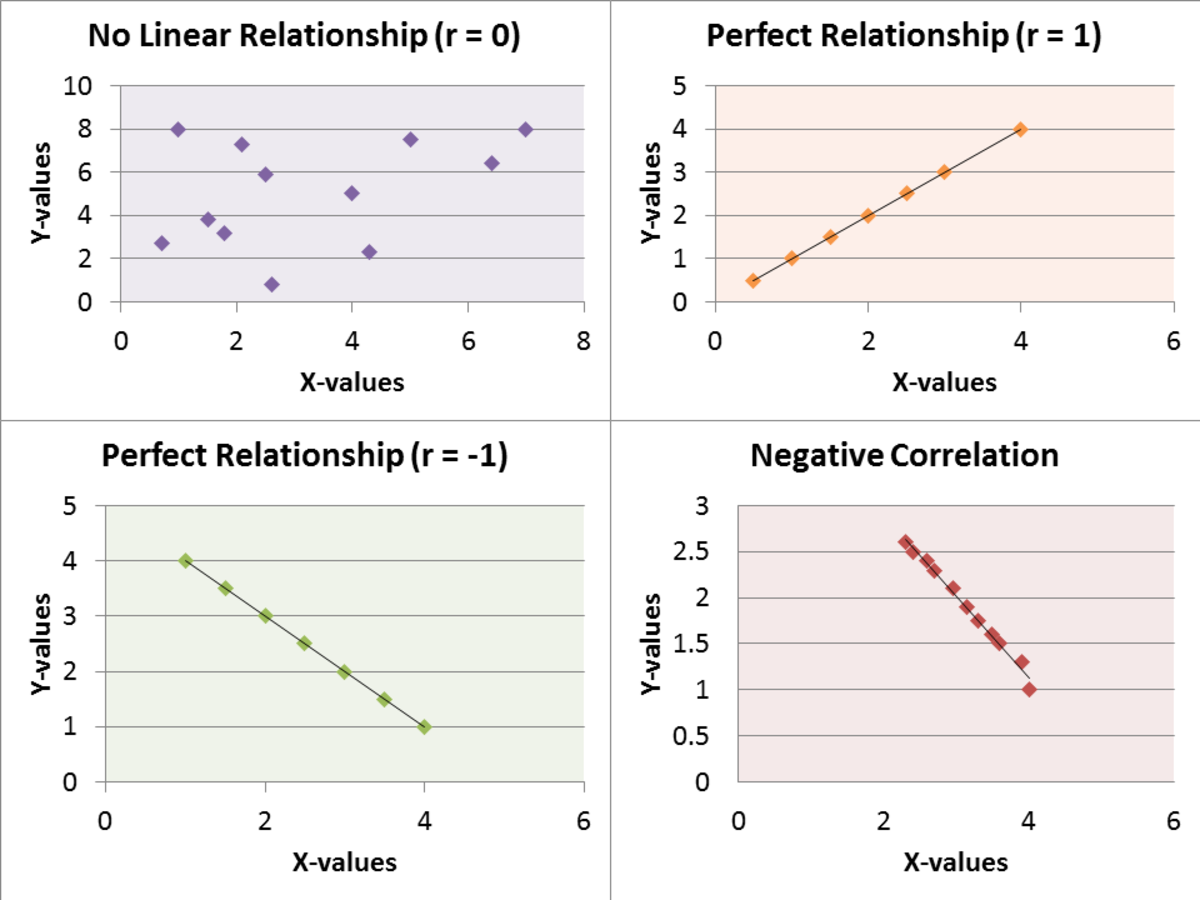
There are numerous options available that enable researchers to clearly report the results of their research such as: histograms, graphic representations, a wide variety of different tables, frequency tables, mathematical representations, and maps. Three tools that I find the most interesting of the many tools statisticians employ are graphic representations, frequency tables, and maps used to plot data because they are all commonly used in statistical studies and are easy to understand. Out of these three tools I feel the most comfortable working with graphic representations because I have been using them since elementary mathematics. I find that I am the most intimidated by maps because I have the least amount of experience with them and I have a dislike of geography in general.
Graphic representations are “pictorial representation of numerical data, such as statistical data, or a method of showing the mathematical relationship between two or more variables by drawing a diagram.” (The Hutchinson Unabridged Encyclopedia, 2014). When a researcher uses graphic representations in his or her study it is normally in the form of straight-line graphs, histograms, conversion graphs, speed–time graphs, bar graphs, and pie graphs (The Hutchinson unabridged encyclopedia, 2014). Graphic representations are a good tool for showing general tendencies in the quantitative behavior of data, but as they are typically approximations they can sometimes be inaccurate or misleading (Encyclopedia Britannica, 2014). As a potential researcher graphic representations would assist me in conducting statistical procedures by allowing me to compare different sets of data easily. For instance if I was conducting a study to discover if online students do better or worse than students who go to a physical campus then I would feel the most comfortable with using the two student groups’ grades graphed on separate graphs. This would allow me to glance at the graph and quickly determine which group has better grades. However graphs do not take into account outside events like a school shooting which would influence the moods and grades of the students in the physical campus; a graph, while helpful, may not be an entirely accurate depiction of which group performs better in school.
Frequency tables are “A table that summarizes the absolute or relative frequencies for a set of observations” (The Penguin dictionary of mathematics, 2008). Frequency tables are a good tool for showing quantitative data; the table can be split into class intervals to condense data and the tables are easy to interpret. The only real disadvantage to a frequency table is when a frequency table uses class intervals instead of the original data the tables loses the original data; this can lead to incorrect conclusions to be drawn from the table. As a potential researcher I would use a frequency table if I was conducting a study to discover how many pets each household in a certain area possessed. The frequency table would allow me to sort the data into class intervals of 1-5, 5-10, 10-15, and 15 or more pets. A disadvantage is that the frequency table would not take into account any qualitative data such as: breed of pet, type of pet, or gender of pet.
Maps can be used by researchers to show data in different areas. For instance a map could be used to show the population of different areas in the United States; the map would use different colors to show various levels of population. A major advantage of using a map as a tool to show data is that a researcher would be able to look at the map and quickly see and understand the data that he or she is viewing. A major disadvantage of using this type of tool is that the data would not be nearly as accurate as a frequency table without intervals; a person would be able to assess the interval of a population in an area, but not the exact number. As a potential researcher I would use a map if I was conducting a study on birth rates based on location. I could color the different areas of the map based on how low or high the birth rates were in each area. This would allow me to quickly see which areas have a higher or lower birth rate, but it would not provide me with the exact number only the interval of birth rates in each area.
References
Brinkhoff, T. (n.d.). World by Map. Statistics, Maps and Charts. Retrieved from http://world.bymap.org/
Frequency table. (2008). In David Nelson (Ed.), The Penguin dictionary of mathematics. Retrieved from http://ezproxy.snhu.edu/login?qurl=http%3A%2F%2Fsearch.credoreference.com.ezproxy.snhu.edu%2Fcontent%2Fentry%2Fpenguinmath%2Ffrequency_table%2F0
Graph. (2014). In Encyclopedia Britannica. Retrieved from http://www.britannica.com/EBchecked/topic/241997/graph
Graph. (2014). In The Hutchinson unabridged encyclopedia with atlas and weather guide. Retrieved from http://ezproxy.snhu.edu/login?qurl=http%3A%2F%2Fsearch.credoreference.com.ezproxy.snhu.edu%2Fcontent%2Fentry%2Fheliconhe%2Fgraph%2F0


