Household Investment Technique III: Rebalancing The Pyramid - Why Is It Important? [264]
Now That You Have Your Personal Pyramid, What Do I Do?
I THOUGHT I WOULD TAKE A QUICK BREAK from my normal fare of politics, economics, religion, and science and come back to another topic in which I have great interest; personal finance. It was five years ago I last tackled this subject and decided to now add Part III.
As was mentioned in the previous Hubs, one of the most powerful features is the balancing act between stock and bond funds. Actually, I should say "re-balancing" act. For, it is the periodic rebalancing of the stock and bond funds back to their original ratios. How to do this was demonstrated in the previous two Hubs. This Hub is to discuss the why.
DEMOGRAPHIC SURVEY #1
Are You
Why is Re-Balancing Your Portfolio Such a Good Thing?
BECAUSE IT USES THE SELL-HIGH, BUY-LOW MAXIM. What makes is this work is that stocks often (not always) go in different directions from bonds. So, theory is that when stocks go up, bonds will go down. The result is the relationship between the percent of stocks owned and bonds owned. This means at the end of, say, 30-days, because the price of the stock rose, the value of that portfolio increased as well. Assuming the bonds didn't increase by the same percentage, then the portfolio will end up more weighted toward the stocks (yes, there will be examples shortly).
At this point, you "re-balance" to get back to the original ratio of stocks to bonds. You do this by selling enough higher priced stocks and buying lower priced bonds to get back to the starting point. When you do this, you end up selling a few shares of stocks and buy a larger volume of bond shares. Latter, when prices reverse, the same thing happens except a higher volume of stocks are bought, while only a few shares of bonds are sold.
Why this is a good thing is it increases the shares owned (which buy-and-hold does not) and each purchase was at a lower price, and the sale was at a higher price, relative to the previous period. As we will see this led to a counter-intuitive series of stock fund purchases as the market crashed in 2008 - 2009. But having done so, it greatly improved your position if your retirement time horizon was a few years or more after the recovery.
Some Examples Are Now In Order
AS THEY SAY, "THE PROOF IS IN THE PUDDING" (no, I don't know why they say it). Another saying is "A picture (graph) is worth a 1,000 words" also applies here. To demonstrate what I am suggesting, several retirement options are presented, each with a different method of saving for retirement.
We will first consider a few examples where a single deposit is made and allowed to grow. The other is period payments into a retirement plan; each has a different outcome. The dataset used consists of an Exchange Traded Fund (ETF) for stocks and a similar vehicle for bonds. Specifically, the SPY ETF, which tracks the S&P 500 stock index is used for stocks, A Vanguard bond index, VBMFX, provides bond prices. The range is from September 2005 through April 2015, a short period for such analyses but long enough for our purposes because it includes the Great Recession of 2008 and the subsequent recovery.
What About A "Buy-and-Hold" Strategy?
THIS STRATEGY MIGHT LOOK SOMETHING LIKE THIS - buy $100,000 worth of SPY in May 2005, and hang one to it until you reach your retirement age (SPY pays a dividend, which is ignored for the moment). What would be your returns if you retired in Oct 2007, Feb 2009, Mar 2013, and Apr 2015? I pick these dates because they correspond to the high point before the recession, the low point of the recession, when the recession (in terms of the market) had recovered, and the end of my data. Table 1 below displays the results of such a strategy (not taking into account the time value of money):
Stock "Buy-and-Hold" Strategy
MONTH/YEAR
| SPY PRICE
| PORTFOLIO VALUE
| $ RETURN
| % RETURN
| % ANNUAL RETURN
|
|---|---|---|---|---|---|
May 2005
| $120.00
| $100,000
| -
| -
| |
October 2007
| $154.65
| $128,875
| $28,875
| 28.9%
| 11.1% per year
|
February 2009
| $73.93
| $61,608
| ($38,392)
| - 38.4%
| - 9.6% per year
|
April 2013
| $159.00
| $132,500
| $32,500
| 32.5%
| 3.6% per year
|
May 2015
| $213.50
| $177,917
| $77,917
| 77.9%
| 5.9% per year
|
TABLE 1
DEMOGRAPHIC SURVEY #2
Is Your Age Between (Inclusive)
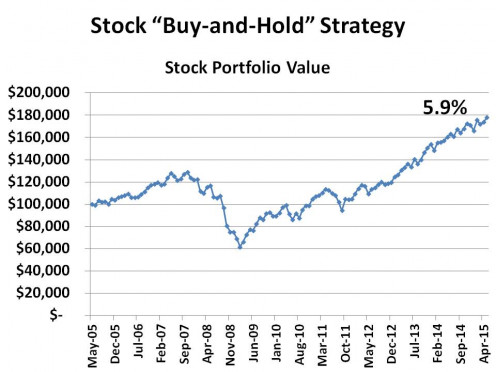
It should be extremely clear that "When" you retire has a very significant impact on how happy you will be. Another fact that should be apparent is how long it takes to get back to normal when the market tanks, in this case 6 years, from 2007 to 2013 to get from the last high to the next! And look what it did to your annual returns. They dropped from 11% per year to start (historical average. for the S&P 500 is 7%) to just 3.6% per annum when prices returned to pre-recession highs; about $155 per share of SPY. The growth after that was strong bringing the overall return to an "almost" respectable 5.9% per annum today (May 2015).
I would think if you had planned to retire around 2009, you wouldn't have. In fact you would have had to keep on working for four or more years because I would doubt the amount of money you had in 2007 was what you had in mind. And, even if your retirement horizon was 2015, look how much ground you lost from 2007 to 2013.
It should come as no surprise that investing solely in stocks is a very risky business indeed, a look at Chart 1 should convince you. So what is safer? One alternative is the much less volatile bonds.
Stock Portfolio "Buy-and-Hold" Strategy Results
Next Consider A Bond "Buy-and-Hold" Strategy
AS VOLATILE AS STOCKS ARE, BONDS ARE JUST THE OPPOSITE, fairly boring. We can, however, plan a strategy that takes advantage of that. What happens then, if you buy $100,000 worth of the bond fund VBMFX? (Bonds also pay a dividend, which is ignored for the time being as well. )Table 2 below presents the results in the same fashion as we did with the stocks; i.e., the initial buy May 2005, the next high before the following low, the low, the recovery back to the previous high, and May 2015.
Bond "Buy-and-Hold" Strategy
MONTH/YEAR
| BOND PRICE
| BOND PORTFOLIO VALUE
| $ RETURN
| % RETURN
| % ANNUAL RETURN
|
|---|---|---|---|---|---|
May 2005
| $9.73
| $100,000
| -
| -
| -
|
January 2007
| $10.30
| $105,858
| $5,858
| 5.86%
| 1.03% per annum
|
October 2007
| $9.58
| $98,458
| ($1,542)
| - 1.54%
| - .06%
|
August 2008
| $10.35
| $106,372
| $6,372
| 6.37%
| 1.02% per annum
|
May 2015
| $10.93
| $111,305
| $11,305
| 11.3%
| 1.01% per annum
|
TABLE 2 - (NOTE: There was a local high of $115,417 in Jul 2012.)
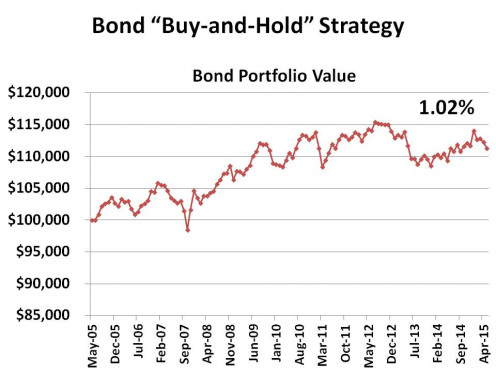
As you can see, bonds are much more safe than stocks; but that comes at a price ... low appreciation. Having said that, your chances of losing your investment are quite low as well.
Chart 2 tells that same story, but much more understandably. If someone took this strategy, they might search around for a somewhat more risky bond fund (longer term or a high-risk bond portfolio) to increase return.
So what else could one do?
Bond Portfolio "Buy-and-Hold" Strategy Results
Dividend Re-Investment
AND THAT WOULD BE TO REINVEST ANY DIVIDENDS you might receive. Both SPY and VBMFX pay dividends of one sort or another. SPY has historically paid out about 1.9% annually, and VBMFX, 6.37%. Instead of pocketing this this, what happens if you reinvest it and buy more stock? Good things, as Chart 3 tells us.
Stock and Bond Portfolio "Buy-and-Hold" Strategy w/ Dividend Reinvestment Results
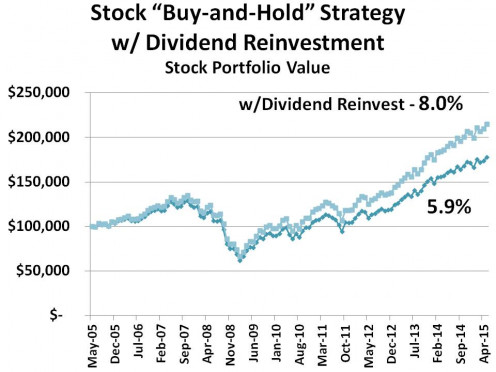
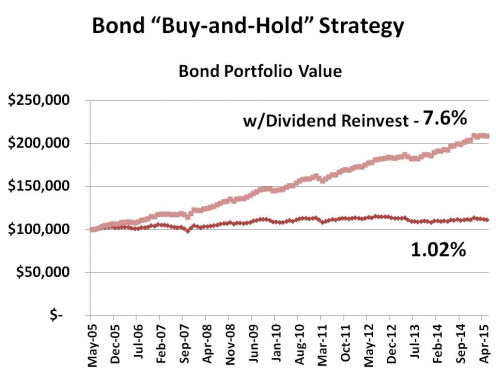
When you reinvest dividends, a couple of surprising things happen; both as a result of the magic of compound the dividends over time.
First notice that in both the stock and bond cases, returns improved dramatically. Second, notice that because bonds generally pay out much higher dividend (interest) rates than stocks, the compounding is much more pronounced. So much so, in are example, that the bonds, with their much lower risk, performed almost as well as the stocks! Shocking.
We are not, however, finished with improving returns.
Mixing Stocks with Bonds
WHY MUST ONE STICK WITH ONLY HIGH RISK STOCKS OR LOW RISK BONDS? Well, you don't have to. Virtually every professional financial advisor out there will strongly suggest you keep a mix of stocks and bonds in your portfolio; similar to the Investment Pyramid which was discussed in other Hubs on this subject. The idea is to decrease the volatility of stocks with the stability of bonds while possibly giving up some return on investment as a price for this "hedging".
Most Financial advisors will tell you that if you are young, with a long retirement horizon, then your portfolio should be weighted heavily with stocks - say 90% stocks and 10% bonds. Over time those ratios should be changed until just before and after retirement, the percentages are reversed, 10% stocks and 90% bonds. (Actually, the stocks and bonds are further divided between different classes of investments in order to diversify the portfolio even further. But that is for another hub.) For our examples, however, I will use a mid-range mix of 60% stocks and 40% bonds. Further, since it definitely improves returns, I will reinvest the dividends.
Chart 5 gives the results when this is done.
60% Stock and 40% Bond Mix Reduces Risk and Increases Return
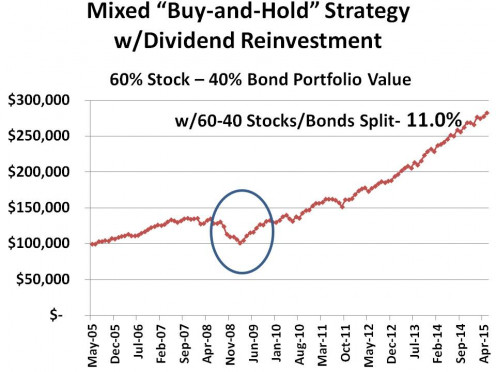
See how the return improved to 11% when stocks and bonds are mixed; while the circle points out how much the downturn was mitigated by the influence of the bonds. That is why the return improved over each case separately.
I suspect you are getting the idea by now, so I will move on to our final scenario and the real point of this Hub. And, that is re-balancing your 60-40 split in order to take advantage of fluctuating prices.
The Rebalancing Act Strategy
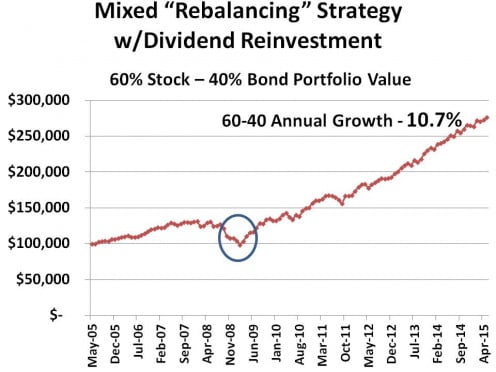
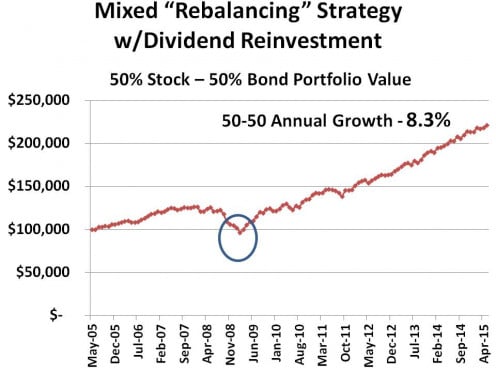
THIS STRATEGY IMPROVES THE RETURN EVEN FURTHER. While it may seem small, even a 1 percentage point return over the long-term makes a major difference.
50-50 Rebalancing At Various Points In Time
MONTH/YEAR
| Stock/Bond Price
| 50-50 Portfolio Value
| $ Return
| % Return
| % Annual Return
|
|---|---|---|---|---|---|
May 2005
| $120.00 / $9.73
| $100,000
| -
| -
| -
|
Oct 2007
| $154.65 / $9.58
| $125,275
| $24,275
| 24.3%
| 9.9%
|
Feb 2009
| $73.93 / $10.47
| $96,673
| ($3,327)
| - 3.3%
| - 0.7%
|
Aug 2013
| $168..01 / $10.66
| $180,841
| $80,841
| 80.8%
| 7.4%
|
May 2015
| $213.50 / $10.83
| $221,088
| $121,088
| 121.1%
| 8.3%
|
TABLE 3
A Rebalancing Strategy Works!
Comparing Stock "Buy-and-Hold" and 50-50 Rebalancing Strategies
MONTH/YEAR
| "Buy-and-Hold"
| 50-50 Rebalancing
|
|---|---|---|
May 2005
| $100,000
| $100,000
|
Oct 2007
| $128,875
| $125,275
|
Feb 2009
| $61,608
| $96,673
|
Aug 2013
| $122,500
| $180,841
|
May 2015
| $177,917
| $221,088
|
TABLE 4
TABLE 4 COMPARES THE "BUY-AND-HOLD" STRATEGY WITH the Rebalancing Act. There should be know doubt who the winner is, and why. What is the additional cost to get the much better return, a couple of hours of your time, once a month.
Your Choice.
I WOULD LIKE TO KNOW
Was THis Hub
Related Links
- Household Finances: Take Control of Your Bills [6]
American's keep getting into financial trouble. One reason is an inability to manage their bills and they let the bills take control of their lives. Learning a few simple ideas, in addition to the obvious on of creating a budget, will go a long way t - Household Investment Techniques: How To Lower Your I...
Investing for any reason is a VERY risky business. If you aren't VERY careful, you can lose it all! That shouldn't shock anyone. The obvious thing to do is REDUCE YOUR RISK. Here's one way. - Household Investment Technique I: The Personal Pyram...
An investment plan should help maximize your investment growth while minimizing your investment risk. This Hub presents one idea to follow based on the proven principle of diversification. - MisDeeds and MisDirection: Just Another Day in Corpo...
Corporate America, by and large, is no friend to Americans, period! That is a broad statement, of course, with many exceptions, but nevertheless that is the reality. This will be an ever-growing hub primarily of Corporate Misdeeds although I reserve - Household Investment Technique II: The Personal Pyra...
This hub adds a twist to the original suggestion on how to distribute your resources among investment types to maximize your chances for growth while minimizing your risk. This pyramid adds in protection in case there is hyperinflation or great econo
HELPFUL BOOKS FOR AMAZON
© 2015 Scott Belford


