Gun Rights: Part 4: Regulations - Will Reasonable Gun Control Save Lives?


IT IS CLEAR FROM AMERICAN HISTORY, AS WELL AS THE CONSTITUTION, that the principal purpose of the 2nd Amendment's guarantee to the right to bear arms was for the "establishment of a well regulated militia"; nothing else is mentioned ... nothing. If fact, it took the activist Roberts' Supreme Court, under the authorship of Justice Scalia, to finally reach back into English history, a century before the founding of America, before they found sufficient legal reference that gave them the rational to allow the application of the "right to bear arms" to the idea of personal self-defense (my source for that statement is reading the Scalia majority opinion, which I site in another hub).
That said, the Supreme Court has ruled 5 - 4 and the right to bear arms for the purpose of self-defense of one's person or loved ones is now part of the law of the land, whether you like it or not; personally, I like it. But, what has happened in the decade since that ruling is that gun advocates have tried to use that reasoning to avoid "regulating" the ownership of guns in any fashion, something the Court has permitted for many decades. To listen to the hyperbole surrounding this issue, regulating guns is no different than banning guns; which, to any person without an agenda, is patently not true.
And it is "regulating guns" with which I am concerned because I know, and can prove, that suitable regulation will save more lives than poor or no gun regulation. What I am doing with these hubs is to analyze the various pieces of the puzzle, find out if any are missing, and connect the dots between each piece. The parts we have considered so far are:
- Rate of Total Deaths per 100,000 population by State (Dependent Variable)
- % of Gun Ownership by State (both an Independent and Dependent Variable)
- A State's Population in 100,000s
- Density of Guns per Square Mile by State (Independent Variable)
- Rates of Violent Crime, and its constituent parts, by State (Dependent Variable)
- Density of People per Square Mile by State (Independent Variable)
- Political Leanings of State Legislatures (Independent Variable)
- Strength of Gun Regulations by State (Independent Variable)
Each of the independent variables were found to be both necessary and relevant in estimating the dependent variables. What we have found so far is that:
- There is a strong correlation between the Strength of State Gun Laws, the Political Leanings of the State, and the Density of the State Population help determine the % of Gun Ownership in that State
- There is a strong correlation between % of Gun Ownership in a State, the States Population, and the Density of Guns in that State with the Rate of Total Deaths by Gun for All Causes in that State,
- There is a weak correlation, at this point in time, between % Gun Ownership, Density of Guns, Density of People, and Political Leanings in a State with the Rate of Violent Crime, Homicide, and Robbery.
- There is no apparently link between the above independent variables and Rape or Aggravated Assault.
- All of the independent variables are positive, meaning the dependent variable increases with an increase in the independent variable except in these important instances, 1) when gun laws are used to predict % gun ownership, the relationship is distinctly negative and 2) when % gun ownership and population density are used, in combination with the other variables, to predict Rates of Violent Crime, Homicide, or Robbery; here, preliminary indications are they are weakly negative as well.
That last bullet is very important to today's debate for it implies there is a possibility that more guns and more tightly packed people may work to slightly reduce certain crimes in some situations. But, does that reduction, if it exists, override the certain increase in total number of deaths, mainly suicides, if guns are more prevalent? That is the question.

Suicides Need to be Part of the Gun Control Conversation
YOU HAVE MANY GUN ADVOCATES, such as @Jack Burton who made several well thought out, logically presented arguments in the comment section of Part 3, who feel suicides, ones by guns, should be taken out of the equation. @Jack argument can be summed up as follows:
- "There are many studies that show that guns have no effect on the total number of suicides. Japan [and] many other major countries with much more stringent gun laws have many more times the number of suicides than we do."
- "The fact is that the overall rate of suicide (firearm and non-firearm) among children age 15 and under was virtually unchanged in states that passed and maintained “safe storage” laws for four or more years."
@Mike adds:
"I really don't see suicide as a gun control issue. Even if a few suicides could be prevented by more firearm restriction, which I feel they can't, I don't believe that warrants more firearm restriction."
@Carl follows up with:
- "Am I the only one that doesn't think suicide should be a factor in the argument of gun control even if firearms could somehow be linked?"
- "It seems that most of the anti-gun people continually argue about their own safety when discussing all the killing machines in distribution, so the only reason for suicide statistics to be included is to help their numbers."
- "Even if I wanted to include suicide rates in the gun control argument, which I really don't, how many of them have been committed with so called "assault weapons" and the stuff that scares liberals that they are currently trying to ban?"
There is another aspect the suicide story that must be considered as well, this was brought up in a reference @Jack provided regarding the trade-off between suicide by gun and suicide by all other means. The proposition is that the suicide rate is relatively constant across states and that if suicide by gun goes up or down from one state to another, the "suicide by other means" will move roughly the same amount in the other direction, thereby making the inclusion of suicides in the gun control debate mute.
Obviously, I don't agree with any of these, although the last one had me going for awhile. Just as clearly, it is not enough to disagree, I must prove my point with data and facts; so let's start with the "linkage" between suicides and the prevalence of guns in a state.
ARE THE QUANTITY OF SUICIDES AND SUICIDES BY GUN LINKED TO GUN AVAILABILITY?
YES AND YES, IN THAT ORDER. There very satisfactory statistical links between the availability of guns and the total number of suicides as well as between % Gun Ownership and the number of people, mainly young people, who kill themselves with guns.
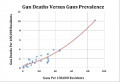
I would like to put this debate to bed quickly and turn to something much more interesting an important, the trade-off between "suicide by gun" and "suicide by other means". Consider Graphs 1 and 2 below, the first plots % Gun Ownership vs. Total Suicides and the other plots % Gun Ownership vs. Suicides by Gun.
RELATIONSHIP BETWEEN GUN OWNERSHIP AND SUICIDES
 vs, % GUN OWNERSHIP (x-axis) -WHILE THE RELATION IS VERY WEAK, OTHER EVIDENCE NEVERTHELESS SHOWS TOTAL SUICIDES WILL GO DOWN WITH BETTER REGULATION")
 vs, % GUN OWNERSHIP (x-axis) - GRAPH 2")
IT SHOULD BE CLEAR BY INSPECTION, as well as the R2 result of 72%, the truth to what I claim. In fact, when I pushed on into multiple regression analysis, I found that for Total Suicides, when you add to % Gun Ownership, Gun Density, Mean Annual Temperature, and Median Age of the Population over 95% of the variation between the predicted and actual data points was explained by the final equation which is:
Rate of Total Suicides = .092 * % Gun Ownership +
.008 * Median Age +
.123 * Avg Annual Temp -
5.243 * Log(Gun Density)
ADDENDUM:
Since I last wrote this, I accomplished additional analysis to use in a Twitter comment. I used new techniques that were applied to subsequent Parts, but not this one. Below is an updated version of the equation to predict the Rate of Total Suicides.
In this iteration, the intercept came back in because it was now significant (in the previous model, it wasn't). But, the R-squared dropped to a still respectable 77% with the addition of two more variables and replacing three of the others. Now the equation is:
Rate of Total Suicides = (Mod Rate of Total Suicides)^(1/0.3)
Mod Rate of Total Suicides = 3.519 - .44693 * 1/(% Males^2)^15.5
+ 32632.05 * 1/($ Hispanic/100)^2
+ 0.59067 * $ Ratio ^ 2.2
+ 0.771291 * Rate of Gun Ownership ^ .25
- 0.42577 * % White ^ 2.4
- 20.913 * 1/(Median Age)^0.7
Likewise, with Suicides by Gun, if I add other factors, Age and Population Density to % Gun Ownership, I gain an additional 22% of variation explanation, bringing it to 94%. The resulting equation of the multiple regression is:
Rate of Suicides by Gun = .111 * % Gun Ownership + .
4.553 * Log(Median Age) -
2.027 * Log(Pop Density)
Below is an updated version of the equation to predict the Rate of Suicides By Gun. I still kept the intercept function forced through the 0,0 point because it makes no sense to have an intercept greater then zero if the rate of legal gun ownership is zero; by definition, the prediction must be zero. Further, I gained two more percentages in my adjusted R-Squared function, to 96% which means the equation doesn't explain on 4% of the variation in the data set. Now that is wonderful .... until you consider the large number of significant explanatory variables there now are.
- Median Age: This is the point where half population is younger and half is older. What the relationship says is that as the population ages, more people kill themselves; it seems reasonable. If fact, a better formulation would be one which increases as the median age gets younger flattens out, then increases as the population ages; the data seems to support this.
- Average Annual Temperature: Temperature seems to be important, given its coefficient of .123. With an average US Temperature of around 52, it contributes around 6.4 suicides per 100,000 to the final rate. It would seem that as the climate warms up, the number of suicides increase as well. I leave it to sociologists to explain what heat vs. cold as to do with the human psyche and our tendency to end our lives, but apparently there is a difference.
- Population and Gun Density: Both are surrogates for how tightly people are packed together. I am still as surprised as I was in the other Parts by the negative coefficient. The negative sign suggests that the closer people live to one another, the less likely they are to commit suicide. It could be there is less opportunity or that loneliness is dangerous.
TRADE SPACE: GUNS vs OTHER METHODS
AS I MENTIONED EARLIER, http://www.keepandbeararms.com/information/XcIBVie suggests that even if suicides are significant, they still don't count because the less suicides by guns there are, people make up for it by finding otherer ways to kill themselves and keep the total suicide rate at about the level. I don't agree with the article's conclusions, of course, and think his use of statistics are misguided, but it is a very good read and very poignant nevertheless. It certainly did give me pause, out two or three days, trying to think the issue through and determine and approach to testing his hypothesis.
During this process, I came across several instances of sets of states where this "trade" phenomenon appeared to be occurring. But, when taking all of the data together, this trade-off between suicides by gun and by other means didn't occur on a consistent basis.
I had built a series of charts and a long explanation of them to show you when a much simpler method occurred to me; this is what I am presenting in Table 1 below:
To explain the charts I will show in a moment, consider the near perfect case where this trade occurs.
-
- Assume that for state X the Suicides by Gun rate is 5 deaths per 100,000. Assume further that for the same state, the Total Suicide rate is 11 deaths per 100,000. That mean, of course, the Suicides by Other Means must be 6.
- Next, assume the state next door which has exactly the same demographics, except their gun laws are stronger, has a Suicide by Gun rate of 4 deaths. Since all of the demographics are the same, then, it the "Trade-off Theory" is correct the Total Suicides should still be 12 because 1 person per 100,000 found another way to kill themselves
If this perfect case
GROUP
| #
| AVG % GUN OWNERSHIP
| AVG TOTAL SUICIDE RATE
| AVG SUICIDE BY GUN RATE
| AVG SUICIDE BY OTHER MEANS RATE
|
|---|---|---|---|---|---|
STATES WITH LITTLE OR COUNTERPRODUCTIVE GUN LAWS
| 37
| 42.6%
| 14.1 per 100k
| 8.6 per 100k
| 5.5 per 100k
|
STATES WITH STRONG OR VERY STRONG GUN LAWS
| 13
| 23.7%
| 10.2 per 100k
| 4.2 per 100k
| 6.0 per 100k
|
TABLE 1
TO SAY THAT 1) GUN LAWS AND 2) SUICIDES DON'T MAKE A DIFFERENCE is to be blind to the facts. Table 1 is extremely simple, but it says volumes. All I did was divide the states between those who have sensible laws regulating guns, 13 of them, and those who didn't, the remaining 37 states. Then I compared the four factors you see across the columns.
The first two things that should pop out at you are the significant drops in both % of Gun Ownership and the Total Suicide Rate when you compare states without reasonably strong gun laws to those states with good laws. The next thing is the last column, Suicide by Guns, that follows the same pattern. Notice, however, what didn't drop, in fact, it stayed almost constant, and that is Suicide by Other Means!
(I didn't compute the statistical test to show whether the means of the two groups are significantly different from each other because I felt it unnecessary. However, if anybody wants me to, just leave a comment to that effect.)
That result would be impossible if the "Trade-off" theory is correct. For that theory to survive scrutiny, exactly the opposite results would be expected. Specifically, Total Suicides must be more or less constant and Suicides by Other Means must be significantly different between the two groups in order to compensate for the change in Suicide by Gun rates. Clearly, the actual data doesn't support this hypothesis, but instead verifies the opposite theory that the prevalence of guns has a lot to do with both Total Suicides AND Suicides by Gun.

USING THE INFORMATION LEARNED SO FAR
THIS IS JUST A DIFFERENT WAY TO SUMMARIZE WHAT HAS BEEN PRESENTED to date, and hopefully in a more interesting and meaningful way, even if you don't agree with the conclusions.. Enough material has been presented in Parts 1 - 4 to allow some insight into how it could be put to practical use, IF the equations offered were more rigorously developed with better scrubbed data and further in-depth analysis. This is a hub, however, and I don't have a large gov't, Brady, or NRA grant to go out to hire researchers and do the proper job needed such that you can take the results to the bank with some degree of confidence that you are right. What I DO have a high degree of confidence in with respect to the work presented in these and future hubs is the direction of my conclusions and the ballpark my answers fall in, Specific policy decisions would not be derived from my work, but certainly the effort is good enough to know the kinds of policy decisions which need to be made.
To see how such a policy might be produced, suppose a question policy-makers asked themselves at the national level is the following:
"What policy or set of policies should be put in place that have a reasonably good chance of reducing the number of total deaths by gun nationwide while not violating the Second Amendment and the recent Supreme Court decision to expand its scope?"
We have the tools now to make an estimate of how many lives, if any, could be saved given changes in policy that effect the ownership and responsibility that comes from ownership of weapons designed for the sole purpose of killing other human beings. Stating it this way, I believe I eliminate any discussion about pellet guns, BB guns, bows-and-arrows, virtually all knives, etc.
What policy-makers do is write regulations, in this case regulations that affect the ownership of weapons in some fashion. There are 51 example sets of regulations in existence now, one for each State and one for the Federal government. We have seen in this and the previous Parts that gun control regulations vary considerably from state to state, as does the scope of gun ownership and the number of deaths as a result of gunshot. From this data, we developed (painfully) various relationships between independent variables that influence gun ownership as well as death by gun. What follows then is using these equations to estimate the change in the number of lives lost, at the national level, based on changes in state regulations.
Previously we saw that, according to one study, there are a set of states whose regulations detract from the federal gun control legislation; these are the states with negative scores. So, let's ask this question: "What is the impact of passing federal laws requiring all states to at least meet federal laws and guidelines?"; meaning those states with negative regulation scores change their laws such that they would score zero on the study. In a very simplified example here is how such a process might work:
- Estimate the change in average "Gun Regulation" score when those states with negative scores are now scored at zero. For the purpose of this example, I did a very rough estimation of what this change might be by simply comparing the "average" score before and after the change. The score before was 9.22 and after making the adjustments, it had increased to 11.02.
- The Gun Regulation score, along with Population Density, is key to estimating the state, and therefore the national % Gun Ownership rate. The coefficient associated with Gun Regulation is ".497". You would think this has the wrong sign because positive implies the more regulation, the more gun ownership. For statistical reasons, however, I did what is called a "transformation" on the Gun Regulation variable which basically did two things, 1) made all of the scores zero or positive and 2) reversing the sequence by subtracting the score from 100; this last transformation is why the coefficient is positive.
- Now, I only have to worry about the change in Gun Regulation because Population Density is constant so I just need to focus on the Gun Regulation coefficient. I will present the math if somebody wants to see it, but when you apply the change in Gun Regulation to the Gun Ownership equation, you find that the % Gun Ownership drops by 0.895 percentage points.
- The next to last step is to take this change in the Rate of Gun Ownership and insert it into the equation which relates gun ownership to Total Death by Gun rate, which is: Y = .661*X, where Y is the Log of Total Deaths and X is the Log of % Gun Ownership. Doing the math with 0.895 we estimate that Total Deaths by Gun would decrease by 3.9 deaths per 100,000 population.
- Finally, to convert that into Total Deaths, we note the current population of the United States is 314 million. Therefore, the estimated decrease in Total Death by Gun would by 805 people which equates to a 2.7% drop from the approximately 30,000 killings each year.
This is the kind of analysis that can be done to help determine if changing regulations might be effective and, potentially, which regulations may have the most affect. This example was to simply bring the laws of 20 states up to the standards set by such states as Utah and Nevada. How many of you think Utah and Nevada's gun laws are onerous and are well on the way to making the 2nd Amendment mute? I wonder what might happen if all the states who scored worse, brought their regulations on par with such a liberal bastion as South Carolina, who rates a 17 on the Gun Regulation scorecard.
For comparison:
-- South Carolina ranks:
- 11th in tough gun laws,
- 33rd highest in gun ownership, and
- 16th lowest in total death rate.
-- Wyoming, on the other hand, ranks:
- 38th in tough gun laws
- 1st (highest) in gun ownership rate, and
- 46th in lowest total death rate,
Question: Why is it South Carolina, who arguably feels just as strongly about the 2nd Amendment as Wyoming, has such a better track record when it comes per capita total death rate? Could it be how they regulate their guns? Doesn't this result agree with the analysis above?
A QUICK LOOK AT SUICIDES
WE CAN APPLY THE SAME METHODOLOGY to the total number of suicides as well as the number of suicides by gun.
From the discussion regarding Graph 2 above, we saw that the coefficient that went along with % Gun Ownership is 0.092 for Total Suicides, and from 3) above the change in % Gun Ownership associated with our example is 0.895. Multiplying those two together gives you 0.08 deaths per 100,000 population. Still assuming a total population of 314 million, we would predict that improving the regulations governing guns could potentially reduce total suicides by 251 people!
If we consider the 0.111 coefficient associated with gun ownership in the formula governing suicide by gun, we get a result of 0.099 or 311 people. Note that this result when compared to the one above implies 60 people found other ways to kill themselves rather than by gun.
THE SUBTOTAL
DO STATE REGULATIONS REGARDING THE OWNERSHIP OF GUNS bear on the degree guns are owned in that state, you should have no problem being able to answer that in the affirmative. We saw a strong and direct correlation between stronger regulations reducing the prevalence of ownership.
Likewise, we see significant correlation between the degree of ownership of guns and the total number of 1) people killed by guns, 2) total number of suicides, and 3) number of suicides by gun. In all three cases, more guns per capita = more dead people per capita. But the title of these hubs look specifically at violent crimes and homicides and asks the question, "Does more guns = more deaths from violent crime and homicides?"
The answer is, "apparently not!", at least not right now and based on additional analysis while preparing for this hub, it doesn't look like it is going to. On the other hand, the opposite relationship doesn't appear to exist either, meaning "more guns doesn't = less deaths from violent crime and homicide". I have one more idea in mind to try to find a relationship and that is considering the number of major metropolitan areas in a state.
Another Way to Look At Regulation vs Gun Suicides
THE NEW ENGLAND JOURNAL OF MEDICINE, IN 2008, released the results of a survey looking into the relationship between 1) Strength of state firearm regulations, 2) rate of firearm ownership, and 3) the rate of suicide by firearms; they are presented in the table below. A quick peek should tell you immediately that these three factors are closely linked.
I have not looked behind the survey, but in this case I don't think it is necessary. Here is why. Normally I would want to know how many states were in each group and their demographic make-up to ensure the statistics derived were not biased. But, within the data presented is enough information to make feel comfortable that the results tell a true story. Let me walk you through it.
- While the number of states in each "High" and "Low" group is unknown, I know from these hubs that each group contains several, of all sizes and shapes. So given each group have about the same average population, results should not be biased one way or the other. This is very important since the suicides are given in actual numbers, rather than rates.
- The next row tells you the average rate of gun ownership. It should be no surprises that states with little regulation have a higher rate of gun ownership than those with strong regulations. But the degree of difference is very surprising.
- The third row gives you the total suicides over a five-year period. Often these types of data don't mean much by themselves because it is very hard to compare them except in very special circumstances. In this case, however, two other pieces of information; 1) populations of the same size and 2) near identical non-gun suicide results.
- The last row contains non-gun suicides in each group. This is what cements everything together, what tells me there is no bias in the data of any significance. The reason for this is that the number of non-suicides and the populations they came from are essentially the same.
- Consequently, the variables which would total gun-suicides meanless have been normalized; meaning taken out of the equation leaving only the gun-based suicides.
Having established the gun-based suicides for each group can be compared, isn't it interesting that states where access to guns is high have 4 times as many suicides as those where less guns are available. Now THAT is a significant difference. What's more it also supports my findings that gun regulations DO have a material impact on how many households have firearms.
ACCESS TO GUNS RAISES RISK OF SUICIDE
VARIABLE (2001 - 2005)
| STATES W/HIGH OWNERSHIP
| STATES W/LOW OWNERSHIP
|
|---|---|---|
AVG POPULATION
| 49 Million
| 50 Million
|
% OF HOUSEHOLD W/GUNS
| 47%
| 15%
|
TOTAL GUN SUICIDES
| 16,577
| 4,257
|
TOTAL NON-GUN SUICIDES
| 9,172
| 9,259
|
TABLE 2
SO, WHAT DO YOU THINK NOW?
Are you now convinced reasonably increasing state and federal regulations will save lives in the long run?
Do you think suicides should be part of the gun regulation conversation?
RELATED LINKS
- Gun Rights: Part 6: Conclusion: Will Reasonable Gun ...
The rate of gun ownership seems to have little affect on rate of violent crime, only Robber (it decreases it) and Murder, (it increases it). We finish with a closer look at total deaths. - Gun Rights: Part 7 - Proof by Chart: Will Reasonable...
There IS a negative correlation between the strength of rational gun regulation and Death ... no matter how you slice it. This translates to lower death rates w/better gun regulation.
© 2013 Scott Belford
Related

Gun Rights: Part 2: Violent Crime: Will Reasonable Gun Control Save Lives?

Gun Control and the Right to Bear Arms: a Foreign Perspective on the Pro-Gun Lobby

Balancing Gun Ownership and Public Safety: A Comprehensive Plan for Responsible Gun Reform

Gun Rights: Part 3: Gun Regulation: Will Reasonable Gun Control Save Lives?
Gun Rights: Not All Firearms Are Constitutionally Protected As Some Would Have You Believe. [278*3]
![Gun Rights: Not All Firearms Are Constitutionally Protected As Some Would Have You Believe. [278*3]](https://usercontent2.hubstatic.com/12935107_f120.jpg)


