Comparing 12 Quarters Of President Obama With His Predecessors ... Not Too Bad, Considering.

NEVER IN THE HISTORY ...
TO LISTEN TO THE LOYAL OPPOSITION, President Obama has done the worst job of any president in the history of this country in his first 39 months in office. The problem is, that isn't even close to being true and I am here to show you why. But first, a little soap-box, if you don't mind.
Never in the history of politics has an incoming president heard the opposition pronounce that the legislative agenda of the opposition party for the term of the president is that, to quote Senator McConnell, "the single most important thing we want to achieve is for President Obama to be a one-term president."! No Democrat said anything remotely like that after Richard Nixon, Ronald Reagan, George H. W. Bush, or George W. Bush were elected President; only the conservatives did when Barack Obama was inaugurated. I will come back to this later because this is exactly what the conservative legislators set out to do, and they have done a damn fine job of it, even though it is destroying America along the way.
CHANGE IN QUARTERLY GDP GROWTH
THE FIRST METRIC WE WILL LOOK AT is the change in quarterly Gross Domestic Product (GDP) growth numbers. It is a measure of how well, overall, this country's economy is doing and is it getting better or getting worse from period to period. It also tells us when we get into a recession, i.e., two successive quarters of negative growth, and when we come out of one,i.e., two successive quarters of positive growth.
Below is CHART 1 which portrays the percent change in quarterly GDP for the four quarters leading up to the change in an administration from one president to another. I start these charts in the second quarter of each year because the inauguration is at the end of January and in any case a president has absolutely no control over what is happening in the first two months of their term in any case. In reality, they don't have a whole lot of say over the second quarter either in terms of this index, but at least we are consistent.
So, what do we see from CHART 1?
(Charts 1 and 2 are read as follows: The bars above Q2, Q3, Q4, etc, are the percent changes in GDP for each president for that particular quarter in their presidency. The height of the bars are the actual percent change.)

WE SEE THAT LEADING UP TO PRESIDENT OBAMA'S presidency, the economy was tanking badly under President George W. Bush. We also see this is not true for any other president listed. Only President G.W. Bush had a one quarter of negative growth before taking office.
The remaining presidents had economies exhibiting positive growth when they assumed the presidency.
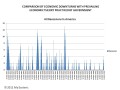
CHART 2 below, tells the story for the next 12 quarters after they took office, starting with the second quarter. I use 12 quarters because that is how many President Obama currently has under his belt.

Note the 3:1 ratio of ressions of Republicans vs Democrats, respectively. To be fair, however, the Kennedy, 2nd Nixon, Carter, and 1st Reagan recessions were not due to that Presidents policies. If fact, the 2nd Nixon, Carter, and 1st Reagan recessions were primarily caused by external factors, mainly the Middle East and oil; which, in hindsight, were traumatic episodes of the same long event. I would have included the 1st Bush 43 recession except that should have just been a natural economic downturn at the end of the Clinton administration but through a combination of factors including Bush 43 policies, turned into a short recession.
It is interesting to see the much maligned President Carter holds the modern record for a single quarters growth, although he has the second lowest quarterly loss as well. Bush 43 holds the honors for the worst modern day overall economic performance given the longevity and depth of the Great Recession; both of which, in my view, are the result of Conservative economic theory for the latter, and politics for the former..
KEEP IN MIND THE CONSERVATIVES PROMISE TO STOP OBAMA'S ATTEMPT TO IMPROVE THE ECONOMY IN ITS TRACKS
ALSO KEEP FRESH IN YOUR MIND CHART 1, because taken together, they explain why Obama's last four quarters don't look like President Reagan's. While I can't prove it at the moment, it is simple common sense that, since 2010 just when things were beginning to get better, you have the minority party blocking every attempt of the majority party to improve the economy, regardless of whether it would or not, and filling the airwaves daily with downbeat messages about how terrible a job President Obama is doing (starting two months after he took office, btw) and keeping this full-court press going non-stop for three years, is it any wonder business is sitting on the sidelines wondering just what in the heck this government (Democrats AND Republicans) are up to. Of course business is hesitant to make any large commitments, would you be? Just as recently as June 13, 2012, in testimony before the Senate Finance Committee, the CEO of Morgan Stanley said as much.
Given what I will explain about CHART 2 and what CHART 1 tells you about the lead-up to when President Obama became our President, I have no doubt about the truth of what I just said.
Because of all the extra information I added to CHART 2, I took a busy chart and made it very busy, so let me see if I can't clear it up a bit. First, ignore all of the arrows, words, and ovals. What is left is the basic chart showing the percent GDP change for each quarter in the presidency of the last seven Presidents, starting with quarter 2 and ending with quarter 13, which for Obama would be the one ending in March 2012. So, to orient you some, the very first bar you see on the left of the chart is the last negative quarter of the 2008 recession, which occurred in the 2nd quarter of 2009. The bar next to it is the 2nd quarter of 2001 in the first term of President Bush II.
Add my arrows and names and you can see highlights of large or otherwise notable upturns and downturns. Finally, the ovals are there to group roughly similar results together.
And what am I trying to show? Well the first thing that pops out, worth mentioning is how many times Republicans show up. But this should not be surprising because in the period shown, Republicans held the Presidency, 84 of the 132 quarters shown. What I was surprised at was how well President Carter's record was at the beginning of his short administration.
The next thing that should be obvious, surprising maybe, given the negative rhetoric from the conservatives, but obvious nevertheless, is what is contained in the ovals. Notice how many times Obama falls into these ovals: Q3 maybe, Q4, Q5, Q6, Q7, Q8, Q11 maybe, Q12, and Q13.
Now, let me ask you, exactly how is that a picture of the worst president in the history of the country? Exactly how has Obama destroyed the economy? Comments please, especially from conservatives; please defend you position if you can or admit you are wrong.
BLOWING YOUR MIND
THESE NEXT TWO CHARTS ARE MIND BLOWERS! Not only are they self-explanatory, they need no explanation; but, I will provide some anyway. They take a look at first time unemployment numbers, something conservatives have made a very HUGE deal about.

I DIDN'T REALIZE HOW POWERFUL CHARTS 3 AND 4 were going to be until I made them. As you can see, I didn't have to add hardly any further information to let them tell their stories. CHARTS 3 and 4 represent first time unemployment claims from newly laid-off employees. It is a leading indicator of what is happening in the economy, like the stock market, which we will look at later.
Before I get to the elephant on the chart, let me spend a few words and the Quarter 1, on the right side of the chart, that is the quarter just before a new President assumes office. Notice that for all presidents, Q1 is historically higher than the three quarters preceding it. Even though these are seasonally-adjusted numbers, the first quarter of any year is terrible, employment-wise. Even so, you can still see that presidents leaving office appear to leave their successors a weakening economy, at least as indicated by rising first time unemployment numbers. Other than Obama, the only other president who suffered a noticeable fate were Presidents George H. W. Bush and George W. Bush.
However, what President George W. Bush left President Barach Obama was, just to understate things at bit, unprecedented in modern history! Simply looking at CHART 3 is awe inspiring to a wonk like me, it almost brings a tear to the eye in its beauty, as does the next chart, CHART 4.

AGAIN, I WAS ABLE TO KEEP MY annotations down to a minimum, for the chart speaks for itself. The conservatives, especially Mitt Romney now, have made much hoopla and noise about how terrible President Obama has done on the employment front. WELL! You sure can't tell it from first time unemployment numbers, now can you???
After you notice the difference between the huge upswing in filings in CHART 3, under Bush, you can now see just as huge a downswing under Obama. NOW, I am going to concede here and now, Obama has not gotten down to where Bush started from, nor do I think he ever will for those were historically very low numbers, rarely seen in American history. So long as he is getting the kind of opposition from the conservatives as he is getting now, those kinds of numbers are simply unrealistic and independents need to understand this; these aren't broken promises, these are roadblocks purposefully put in his way that our laws won't let him circumvent.
Having said that, look where he has ended up, a very short two years after the worst recession since 1937; right in the middle of the pack!!! (that is the large oval) Since his eighth quarter in office, the one ending in Dec 2010, he has out performed President George W. Bush in comparable quarters in this category; that is what all those little ovals are! Unbelievable, given today's rhetoric from the Right, don't you think?
AND YOUR OPINION IS??
NOW DO YOU THINK PRESIDENT OBAMA HAS DONE SUCH A HORRIBLE JOB WITH THE ECONOMY DESPITE EVERYTHING THAT ROMNEY IS SAYING?
TYING HUBS TOGETHER
THIS IS WHAT I FIND SO INTRIGUING, tying several disparate hubs together. I have a case with this one and two others I wrote concerting Right-wing Authoritarian (RWA) Followers and Social Dominance Orientation (SDO). These hubs describe two different types of social orientations common in political orientations and have scales associated with them which roughly correlate to the higher you score, the more conservative you are. That isn't 100% true because those on the far left can score very high as well because they often show the same traits, just not as frequently.
Those of you have read these hubs will know what I am talking about, especially if you have taken the surveys, with what I am going to say next. If you are a conservative and still believe, after having considered just these two charts, that Obama is still the economic demon your conservative leaders and talking-heads make him out to be, you are likely going to score high on the RWA survey but probably low on the SDO survey. If you know that Obama is doing OK economically speaking and are aware that your actions are probably having a negative effect, but still keep them up for political gain, then you will probably score high on the SDO survey.
Try them and see.
DEMOGRAPHIC SURVEY #1
Politically Speaking - Do you find yourself Agreeing with the ...
DEMOGRAPHIC SURVEY #2
Are You
RELATED HUBS
- The American Dream: The "Occupy Wall Street" Movemen...
The Conservatives have one idea on how the economy ought to work and the Liberals have another. This hub explores the difference and looks at the historical data back to 1945, to see what really happened.
© 2012 Scott Belford
Related

Independents and Conservatives With a Conscience: Answer Me This Please.

Presidents' Daughters: Then and Now After the White House

Has President Obama Been Lax on Gun Control?
Do You Still Think a Corporate Raider Would Have Been Better for Our Economy? (Up-Date)
American Dream: Conservative View - Did Conservative Economic Policy Work?