Trading Moving Averages

Simple Moving Average
Most traders use technical analysis tools and indicators as well as fundamental analysis to help them decide when to enter and exit the market. In this hub I am going to explain one of the most popular and easiest to interpret technical analysis indicators - moving averages. There are three types of moving average, the simple moving average, the exponential moving average and the least popular and least used, linear moving average.
The simple moving average is a trend line which is plotted on a price chart. This line indicates when and where a trend is about to start or to end. A trend is a continuous movement in a particular direction.
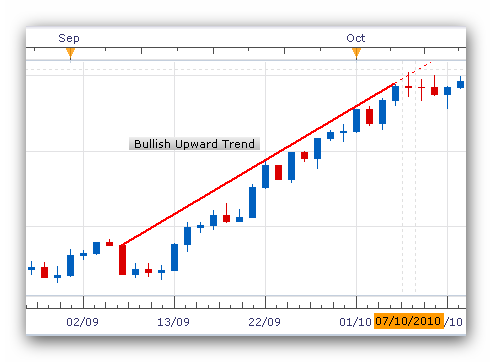
For example the EUR/USD daily price chart below is showing a bullish upward trend over a period of time between September and October 2010. Each candlestick represents the price movement for a day and although within the general trend there were days when the price of the Euro dropped. Overall however, the the price gained a thousand pips in two months.

How the Simple Moving Average is Calculated
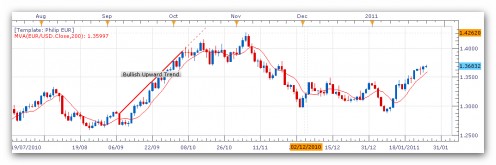
The simple moving average trend line is calculated by adding the closing prices of the currency pair over a specific number of historical time periods. For example if the specified periods were 1 day and the historical time period was 200 days, then the calculation is (200 x the daily closing price) / 200. This applies to any applicable period. The periods most used are 15 minutes, 1 hour, 4 hours, 8 hours, 1 day, 1 week, 1 month. The number of periods used depends on what the trader wants to use the simple average for. Below is an example of a simple moving average line for 200 periods, days in this case, as we are using a daily EUR/USD chart. This shows the general trend over a period of time but the line does not follow the price movements that closely. There are instances when the prices are above the trend line and some instances when they are below it.
Simple Moving Average Strategies
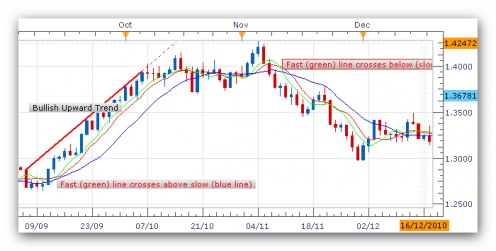
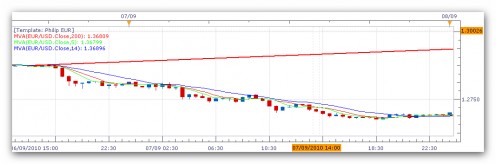
Most traders who use simple moving averages use several trend lines to indicate if and when a new trend is either beginning or ending. They do this by using at least two simple moving average trend lines. One of the trend lines will be the fast line and this line will be the most responsive to price change as it covers just 5 periods. The second trend line will be the slow line and this line is less responsive to price change and covers 14 periods. The chart below is the same EUR/USD price chart and I have added two simple moving average lines, a 5 period line in green and a 14 period line in blue. The 1st price chart is a 1 day chart, the second chart a 4 hour period chart and the 3rd is a 30 minute period chart. The theory behind using two simple moving average lines is that when the fast line crosses above the slow line this indicates a bullish trend. On the other hand when the fast line crosses below the slow line then this indicates a bearish market, a downward trend.
Daily Price Chart
As you can see from the price chart above the fast line (green) crosses the slow line (blue) around the middle of September confirming the bullish trend shown by the very slow red line. It then crossed back down over the blue line at the beginning of November confirming the bearish trend shown by the red line.

4 Hour Price Chart
The 4 hour chart above covers a time period from when the bullish trend started at the beginning of September, to the end of September. Notice how many times the green fast line crosses up and crosses down over the blue slow line during this period. This indicates intra day trends which might not always match the longer term trend.
30 Minute Price Chart
The 30 minute price chart above which covers the 6th of September shows an even more roller coaster intra day price movement than the 4 hour chart. See how the fast line crosses above and below the slow line many times during the day.
Exponential Moving Average
The exponential moving average is comparable to the simple moving average with the difference being that more weight is given to the most recent prices. So the exponential moving average reacts faster to changes in price. The same periods of 5, 14 and 200 are used and some traders even put in a 50 period EMA. I have used the same EUR/USD 1 day chart as the first one we used and instead of using SMAs I have used EMAs and added an additional 50 period trend line. The difference is slight as you can see but the EMA reacts faster. I personally prefer to keep to the SMAs because I feel that EMAs sometimes give a wrong signal because there is too much trading 'noise' around especially during volatile periods.

Linear Moving Average
This particular moving average has a much higher weight on the most recent prices. This works by taking each closing price for the period the moving average is being calculated and multiplies the price by its position in the series. If 13 periods are being calculated today's closing price would be multiplied by 13 and yesterday's closing by 12, and the days before by 11 and so on. Once summed they are then divided by the time period selected by the trader.
A Simple - Moving Average Strategy
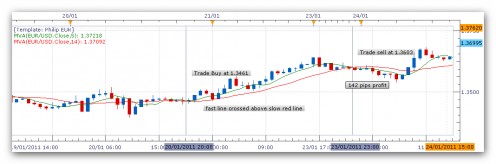
Here is a strategy which I have used with some success in the past. I used two simple moving average lines, a 5 period fast indicator and a 14 period slow indicator on a 1 hour price chart. For a bullish trend I wait until the fast line crosses above the slow line and then wait until the current candlestick has filled completely. This means that on average you will wait a little less than an hour from the cross over before you trade. If the candlestick has confirmed an upward trend, enter a buy trade. Wait until the fast line crosses below the slow line before you exit your trade. As you can see from the EUR/USD 1 hour chart below, I did just that on the 20th January 2011 and exited on the 23rd January with a 142 pip gain. For a bearish trend do exactly the same thing except of course this time you will sell on the cross below the slow line plus candlestick and exit the trade when the fast line crosses above the slow line.
Incidently all the charts in this hub are taken from the FXCM Meta Trade 4 trading platform that I use.