Placing charts, spreadsheets, and other screen objects into your article

How do you do it?
Before I go into the long explanation of how a chart can be added to your hubpage, I wanted to show you (as I have down below) that it can definitely be done.
The bad news is that there are many steps ... the good news is none of them are difficult or very time consuming. If you can point, click, drag your mouse, and press a few keys on the keyboard, then you can perform this task with relative ease ... you just need to know how it's done.
So, now that I have proven it's possible, I will move onto more important things ... like researching how to select the perfect band for your next bar mitzvah ... Okay?
What's that? You want a more in-depth explanation? Well ... You seem like a nice enough person, so I suppose I could go into a whole production number on how this is done. However, as my video editor is broken, you'll need to suffer through my slideshow approach.
Still in? Good! Let's learn how to add charts, screenshots, and anything else we can display on our screen into our articles. Okay? Roll 'em!
My sample chart
What's possible - what's not?
First off, let's talk limitations. I want to say 'If you can display it on your screen, then you can place it into your hub.' Well ... that's not exactly true.
For instance, you can't use my system to incorporate videos, but there are already other tools to get that task done. My method revolves solely around taking snapshots of your screen and changing them into pictures, so they can be incorporated into your articles. Are you still with me?
*But ... but ... I don't have a camera Yoshi!*
*sigh* Then I suppose our lesson here is done ... or maybe ... just perhaps ... you don't need one!
Did I see your eyes light up on that one? They should have, as that statement is 100% accurate.
I will show you how to take any screen image, make a picture out of it, and then allow you to add it to your article. Sounds like sci-fi, eh? Well then, let's make it so! (It sounds so much better when Patrick Stewart says it)
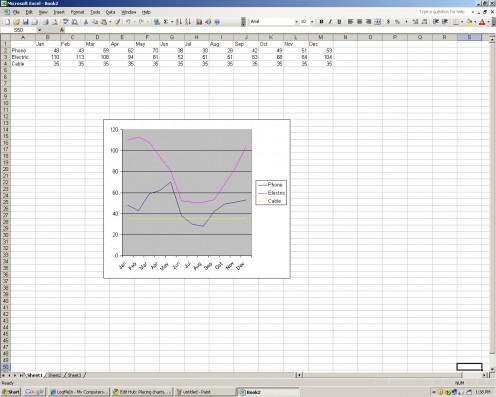
This is our Excel spreadsheet and our chart

What we want to do in this exercise is cut out the chart and turn it into a picture, so we can add it to our article. Sounds like fun, eh? Good!
Step one: capture the screen
*um ... okay ... you can take your hands off the side of the monitor now.*
To capture the screen image, you will press Ctrl-PrtScn on your keyboard.
Did you do it? Pretty anti-climatic, eh? For you see, nothing happened as far as your eyes are concerned, but - as you will soon see - something magical happened in the background, and we are about to tap into that. For now, we can close Excel, as we are done with the program
Nobody loves Microsoft Paint
This program comes with every edition of Microsoft Windows, but for some reason it never gets much love. Though it's plain and nearly featureless, it does have some wonderful uses, and I'm about to share one of them with you.
Let's open Microsoft Paint. You can easily open it by clicking start, then run, then type pbrush and press the enter key.
Got it open? Good! Now click edit and then click paste.
When I did it, I wound up with this:

Yep! That's our screen from earlier. As you can see, we now have a screenshot in Paint, which we can edit and manipulate to our heart's content! Let's start with removing everything but the graph.
Click the dotted star icon in the upper-left corner and then click the dotted rectangle to the right of it. Then, drag a box around what you want to keep (in this instance, the graph).
Next, click edit and then click cut. Your screen should now look like this:
My chart! It's gone!
Where did it go!
Now, now, relax a bit. We just sent it to our magic place so we can clear off the rest of the junk we don't want. It will be back ... I promise.
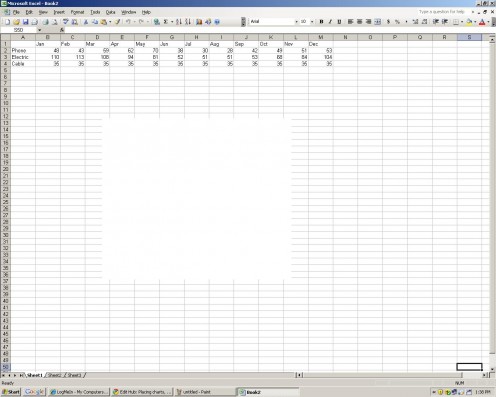
Click File and then click new ...
As you can see, now everything is gone. Happy?
I'd leave you at that for being such an impatient little critter, but I do realize patience comes with seeing results, so I will show you some.
Click edit and then paste
You should now see this:
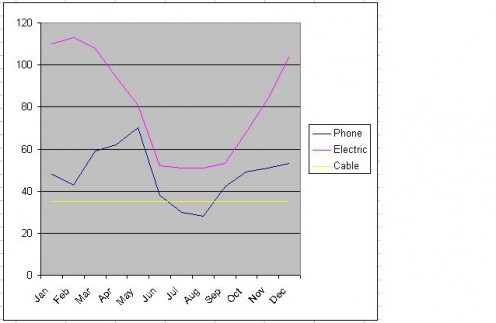
Now THAT is a result, and a very positive one at that!
Gives you ideas ... doesn't it? After all, we're still inside a graphics editing program (a primitive one, at that). What else can we do?
I know, let's add some text!
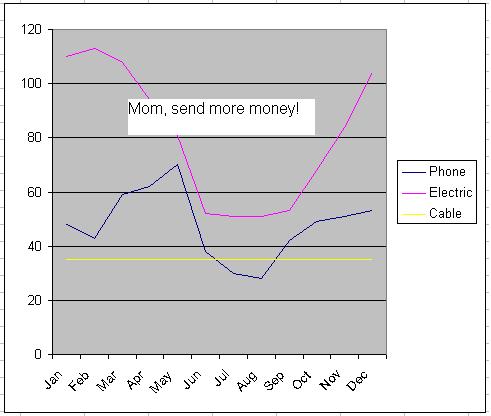
Wallah! There ya have it!
Of course, we don't want it there ... we want it inside our article, right? We need to save this as something.
Click file then click 'save as'. Where you see the dropbox for 'Save as type' choose JPEG and then enter a filename for your file and place it somewhere you will remember it later (highly important!)
Once that's done you can close Paint, open your article, then insert your graph, spreadsheet, chart, whatever, as a picture! Wahoo!
You can rule the world!
Or maybe not ... but you did learn something really cool today!
So what will you do with this newly found power? That, I leave up to you. Just be certain to bookmark this page in-case you forget later how this was done (ah, forgetfulness, the punishment for having to remember so much).
And so, I hope you will benefit from what I have taught you. As for me ... I'm off to research that bar mitzvah article ... Take care!


