Running a t-test in SPSS

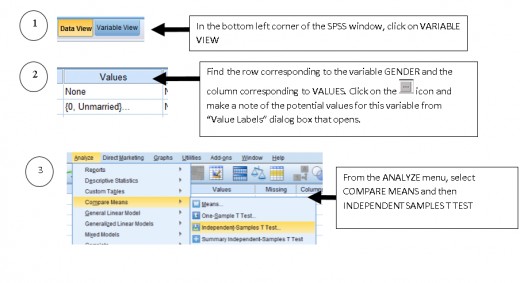
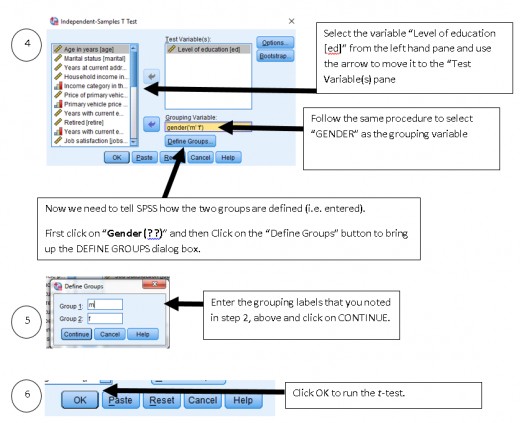
1. Running a t-test
Is it possible that there are systematic differences in Education Levels by gender in this dataset? We will now perform an independent samples t-test to determine whether there is a systematic difference in salary between men and women in this this sample.
Begin by setting up the null and alternate hypotheses in figures and words.
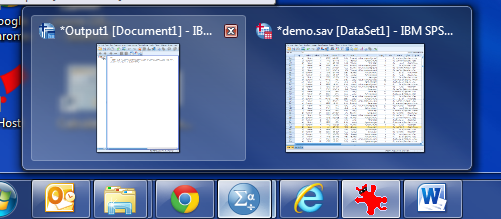
SPSS will produce output in the output viewer. When you hover over the SPSS icon in the task bar, select the SPSS window that says “Output1” and has a blue icon in the top-left corner.
EXAMPLE (USING DIFFERENT VARIABLES): To give you some pointers for interpreting output we have run a t-test on the variables GENDER and NEWSPAPER SUBSCRIPTION (whereas you have used the variables GENDER and JOB SATISFACTION). The output looks like this:
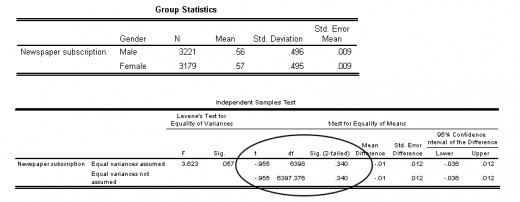
For now, we are mainly interested in the figures reported in the circle, namely, t, degrees of freedom (d.f.) and Significance (sig.). (Note: For future reference, “sig” is usually reported as “p” in other SPSS output). “d.f.” gives you an indication of the sample size (d.f. + 1 = n) and Sig is an exact version of the number that you can look up in a t-table that would allow us to reject or fail to reject the null hypothesis.
This is the logic: If the null hypothesis is likely to be true, then sig. (or p) is the probability of finding a difference this large or larger by chance alone – in this case the probablitity is 0.340, or 34%. In other words, in this case, there is a large probability that the observed difference between males and females in Newspaper Subscriptions is due to chance.
When Sig. (or p) is less than alpha then you should reject the null hypothesis and conclude that there is a statistically significant difference between the two groups in the variable that you have measured. When Sig. (or p) is not less than alpha then you should fail to reject the null hypothesis and conclude that there is no statistically significant difference in the variable that you have measured between the two groups.
IN THIS CASE p is greater than 0.05 so we would conclude as follows: We fail to reject the null hypothesis (t = -0.955; d.f. =6398; sig. = 0.340) and conclude that there is no statistically significant difference in Newspaper Subscription rates between males and females.
NOTE: When you conclude, you should always report the values of the statistic (e.g. t), degrees of freedom (if applicable) and sig. (or p).
2. Printing your output
Make sure you are in the output viewer. Select File and then Print from the menu at the top of the screen.
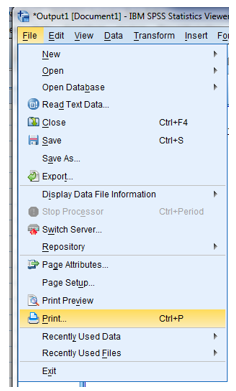
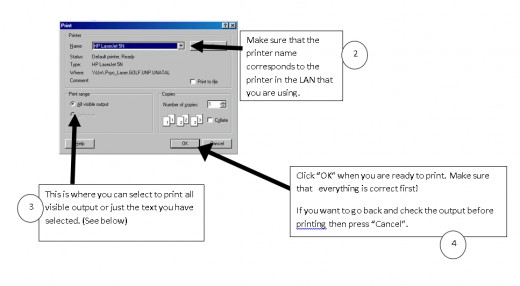
You should now see the print dialogue box:
For a more in-depth explanation of how to run a dependent (or paired) or an independent t-test in SPSS, you can watch the tutorials below.