Data Shows Tangible Link Between Sunspot Activity and Destructive Earthquakes

The Period of Maunder Minimum Corresponds to Increase in Deadly Earthquakes
Highs and Lows of Sunspot Activity Linked to Damaging Earthquakes
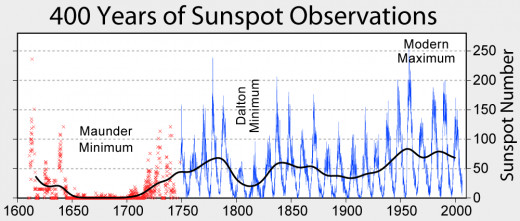
For years it has been generally accepted that the sun influences such things as short wave radio reception, satellites, power grids, and even the weather. There are doubters among the scientific community regarding that last category, but during the Maunder Minimum (depicted graphically in the picture above) the sun produced almost no spots for a number of decades and during that time it was much colder than usual on our planet. It is even more controversial to think that the sun can influence the occurrence of earthquakes terrestrially, but I have believed that such was the case for quite a long time.
I have noticed during periods when earthquakes were frequent that there was often a corresponding period of either peak sunspot activity or quiescence. In this hub I will explore specifically the link between sunspots and earthquakes where it will be my intention to demonstrate this to you so convincingly that there will be little doubt of the validity of such a notion.
A while back I posted a few hubs related to this subject. Looking back on those efforts I now believe that it didn't convince anyone except those who were already believers in such proselytizing. This later group is probably such a small minority that it is possible that nobody but non-believers encountered my hubs and without too much thought rejected the notion and my article post-haste. The two articles that added UFO sightings as also effected by solar activity may not have helped.
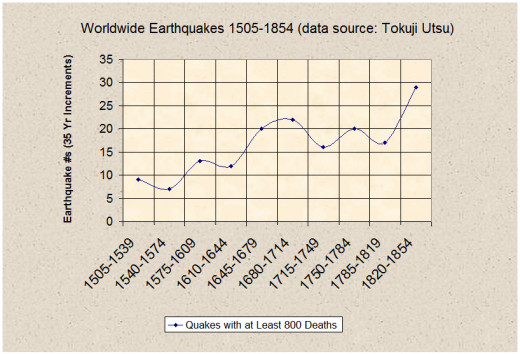
The earliest of these hubs, and one of my first (my fifth) published at hubpages, was posted here almost a year ago. Included in that hub was a chart that demonstrated graphically the flow of earthquakes with at least 800 deaths for each during the period starting in the year 1505 and ending in 1854. What it clearly showed (displayed below) was a significant increase in such catastrophic quakes in two back-to-back 35 year periods beginning in the year 1645 and ending in 1714, or all but a couple of years defined as the period of the Maunder Minimum of nearly non-existent sunspot activity on the face of the sun.
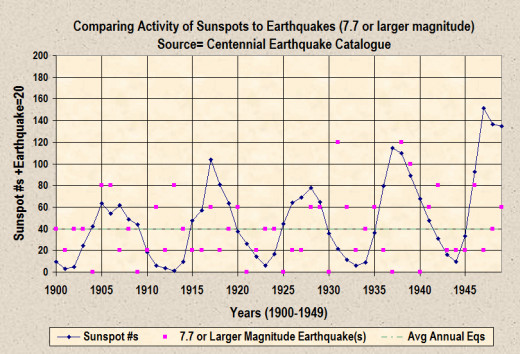
In a similar fashion to that discovery (or confirmation of a hunch I had then) I now wanted to dig even deeper into the subject so as to uncover even more convincing data. In my quest I utilized a comprehensive database of earthquakes and compared graphically the possible parallels between sunspot and earthquake activity. From the beginning of the 20th century and up to the present I extracted all quakes of 7.7 magnitude or greater.
From 1950 to the present it appeared obvious to me that earthquakes of that size were concentrated in years that occurred at or just before the sun's minimum activity. Based on the pattern that was confirmed before my eyes, I estimated the starting and ending points of sections within the solar cycle where such large earthquakes were most active.
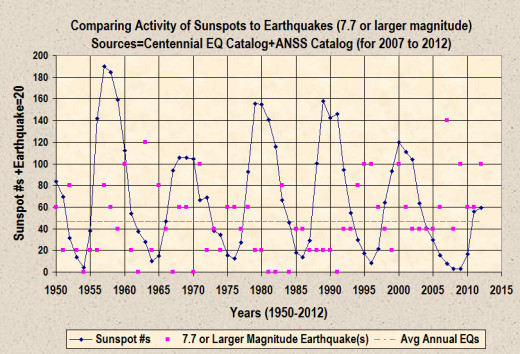
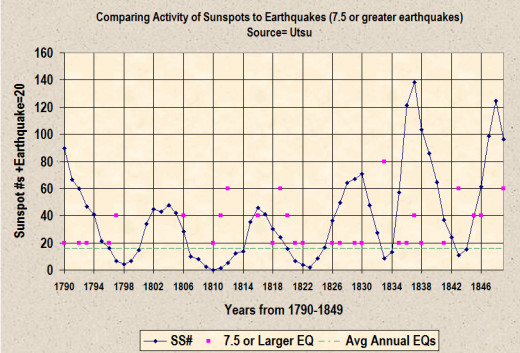
I sifted through the 63 years of data and counted out the events in the years where they totaled more than 1.7 times the yearly average. There turned out to be 44 quakes in the zone at or near solar minima and 14 events in the zone that corresponded to solar maxima (with 10 events out of range). When I looked at the first half of the century though, 32 quakes (in years where they totaled at least 1.5Xs the average) happened within maximum sunspot zones while 26 quakes occurred in zones of minimum sunspot activity (with 7 events out of range). What this seemed to show was that when the peak solar output was tamer, as was often the case in this earlier period, so too was the effect at solar minima (and an enhancement at solar maxima). Also, when a particular solar cycle is at least moderately low, there is more likely to be an increase in randomness. However, when a solar cycle is significantly lower than usual, more quakes are typically unleashed as well. At such times one may most often predict heightened activity within that wide time frame, but it would be difficult to pin down an exact time within the general period of when one might occur. Note the period of the early 1800s in the graphic below. The highest peaks during the 1810-1822 time frame were in out-of-range zones.
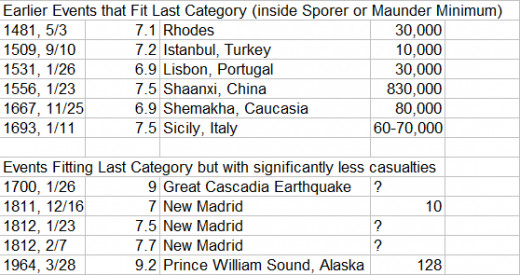
To further confirm my findings I collected the most deadly quakes of 6.9 magnitude and above from what appeared to be a very comprehensive and accurate database at Wikipedia. Destructive earthquakes with at least 10,000 deaths were chosen from their listings of historic, 20th century, and 21st century events. I then determined if each quake was inside the maximum zone, minimum zone, or out of range in either the ascending or descending zones. What I found was that, when it came to the annual average for inside or outside the extreme zones, the frequency of the number of quakes was nearly twice as much within the two extreme or primary zones as was the case in the out-of-range, intermediate or secondary zones (see illustration below showing the number of events in each zone; yellow defines the extreme zones at the times of solar minimum and maximum). Since the cycle used in the displayed solar cycle is 12.5 years in length rather than the average of 11.1, the breadth of the yellow or active zones was stretched to 1.13Xs more than their normal values (for example, the active zone at or near solar minimum normally would be 3.5 years but in the graphic it is 4 years).

Perihelion of Earth Also Linked to an Increase in Large Scale Seismic Events
Another interesting bonus was the fact that of the 26 quakes inside the primary zones, 10 were within a 52 day range from December 16 to February 5. Statistically one would expect the number of quakes within such a period of time (1/7th of a year) to be 3 or 4 in number, but instead there were 2.7 times more than that. Further, if one looks at the six most deadly quakes (of 6.9 magnitude or greater) that occurred during the Maunder and Sporer Minimums, half of them were in the same 52 day period.
Along these same lines, when looking at quakes that fell within the solar minimum zone but not utilized for this second study because there were less than 10,000 casualties for each, one finds that 3 of the 5 listed were within this 52 day time frame. If this date range is extended from February the 5th to the 7th (or to 54 days in length), all three of the great New Madrid earthquakes would fall within that anomalous time frame (and 4 out of the 5 such quakes would then fall within that range). What may relate to this is that the earth is closest to the sun in its orbit around each January 3rd or 4th or just a few days prior to the midpoint of this 52 or 54 day period.
And finally, if one looks at the quakes with at least 10,000 deaths that were out-of-range of the solar minima and maxima Zones, 6 of 11 of those events were within this same 52-54 day time period. One may want to consider more than a coincidence the fact that the sun rotates once every 27 days (fitting twice into this small time frame if it again is 54 days instead of 52).
In closing it should be noted that during the Dalton Minimum of the late 18th and mostly early 19th centuries, not only were there three great New Madrid Quakes in late 1811 and early 1812, but the great Tomboro volcanic eruption also exploded east of Java on April 10, 1815. This eruption is less well known than the Krakatoa eruption of 1883, but it ejected about 8 times more pumice than this more recent catastrophe. Approximately 90,000 people lost their lives due to the 1815 eruption (10,000 directly from the immediate effects of the erupton on nearby Sumbawa and other islands and the rest later from famine or disease). The following year was known as "The Year Without A Summer" since the atmospheric cloud produced by Tomboro, blocked the sun from effectively warming the earth at that time.
There is recent evidence that we are entering such a minimum period of solar activity (also hinted at for the present cycle displayed on the right side of the graphic above) that could extend for at least two solar cycles. Should we also be ready for similar disastrous events during those decades? We may want to beware of the early winter periods of December 16 through February 7th for at least the next 30 years.
.")
A final note: It is apparent that some of the largest earthquakes, such as the Valdivia, Chile quake of 1960 and the Sumatra quake of 2004, both of at least 9.0 magnitude, were out of range of the usually more active zones in the solar cycle. In other words they did not gravitate to either of the two extremes of minima or maxima. This doesn't mean that such quakes always end up outside of those zones. For example, the Great Cascadia Earthquake of 1700 and the Anchorage, Alaska quake of 1964 both occurred at a time of solar minima. Thus it is rather a case that they appear to occur at random. It still remains to be seen whether the last such quake, or the one which occurred in Japan on March 11, 2011, falls into either an active or less active zone of solar activity. Presently it appears that it occurred close enough to solar maximum to be within the confines of that extreme phase of the cycle, but it is still uncertain as to whether or not we have already or will soon reach (within the next six months or so) the peak of sunspot activity in the current cycle. One thing does seem certain though; we are presently experiencing an anemic sun when it comes to sunspot production and thus deadly earthquakes should also be on the rise.
Earthquake Weather Update
This just in. I just discovered an article written by Stuart Clark and published September 26, 2012 at the newscientist.com website (magazine issue 2884) entitled "Solar Maximum? Oh, You Just Missed It". In a nutshell it says that the northern and southern hemisphere of the sun are so out of synch right now that there was already a mild solar maximum in the middle of 2011 within the sun's northern hemisphere and one isn't expected inside the southern hemisphere until early 2014. At the very least, this spells a much smaller peak for a solar cycle than we have been used to for many decades. One source for the article thinks that this is likely a temporary anomaly and that it will be followed by a more typical cycle with a peak perhaps about twice as high. At least that is what happened following the dwarfed cycle that ended back in 1913 (see chart below). On the other hand, this cycle could also spell the start of another sustained period of minimal sunspot activity, perhaps lasting as long as the Maunder Minimum of the late 17th and early 18th centuries (which I suggested earlier in this article). Or it could spell something in between these two possibilities, perhaps yielding only two or three dwarf cycles such as happened during the Dalton Minimum in the early 19th century (see illustration of these cycles in the display for 1790-1849 about midway into the above article).
© 2012 Joseph Ritrovato


