How to plot a horizontal or vertical line like x = 4 or y = -2

A horizontal line (-) has the formula:
y = a number
A vertical line (|) has the formula:
x = a number
Question 1
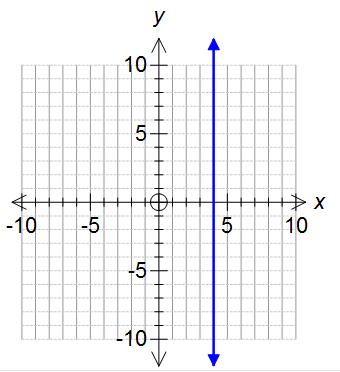
Plot the line x = 4.
Basically, this is a vertical line which passes through the number x = 4 on the x axis.
Notice that the line is perpendicular (at a right angle) to the x axis, and not parallel to the x-axis. Also, any point that is on the line has an x coordinate of 4.
Question 2
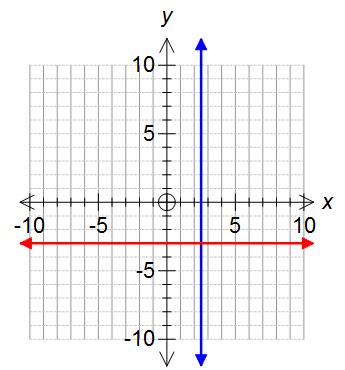
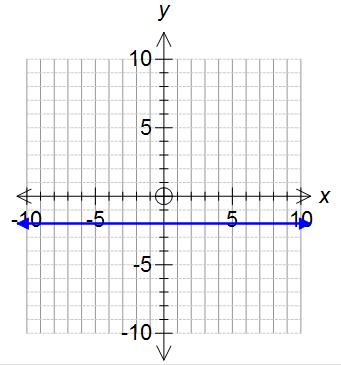
Plot the line y = -2.
This time you have a horizontal line as the formula is y = a number. Therefore, the line passes through the y axis at y = -2.
Notice again, that the line is perpendicular to the y axis and not parallel to it. Also, if you pick any point on the line then the y coordinate will be -2.
Question 3
Plot the lines x= 2.5 and y = -3.
Also write down the point of where the two lines intersect.
x = 2.5 is a vertical line that passes through the x axis at 2.5 (a vertical line)
y = -3 is a horizontal line that passes through the y axis at -3 (a horizontal line)
Now, the intersection point of the two graphs is where the two lines cross.
Therefore, the intersection point of our two lines is (2.5,-3). Notice they are the numbers that are in both formulas.
For some more hubs on graphs check these out:
How to draw a quadratic graph (a curve or parabola). Like y=x^2 -2x -5
Straight line graphs. How to plot a sloping line in math using a table of values.