Earthquakes Are Predictable - There Are Many Ways


Predicting Earthquakes Is Precarious
The theory of Earth Crust Displacements, of the late Charles Hapgood, seems to contain clues between wandering poles and Earthquakes.
The current scientific attempts to predict or forecast Earthquakes, like:
- Radon emission method (attempt to predict),
- Electro-Magnetic Emissions method used by the French satellite Demeter (attempt to predict),
- Statistical driven methods (methods to forecast).
All three methods are still not very successful.
This implies that the assumed processes that lead to Earthquakes are still misunderstood and that science is probably looking in the wrong direction when attempting to predict Earthquakes.
This website has much more background information about statistical driven methods of Earthquake forecasting.

Using Animals
In 2009 scientists of the English University of Milton Keynes researched a colony of Toads at an Italian lake. They witnessed that the Toads suddenly interrupted their mating rituals and that nearly all Toads left their settlements around the lake.
Five days later a heavy earthquake hit L’Aguila at a distance of 80 km from the lake. A few days after the Earthquake, the Toads returned to the lake. The conclusion is obvious: Toads can sense that an Earthquake is imminent.
The Toad isn't the only animal that senses an upcoming earthquake. Mice, Snakes and Fish also seem to change their habits a few days before an Earthquake. It looks that a thorough study to animal behaviour in relation to earthquakes is likely to be more fruitful than launching again another expensive satellite.
What is Stick-Slip?
Stick-slip is a whimsical motion between two 'bodies' that slide along each other, that is caused by at least two forces that are (almost) perpendicular to each other.
A stick-slip motion starts when the lateral force overcomes friction. The motion stops when the lateral force is smaller than friction. This cycle can repeat itself many times until the stress is totally released.
Living Along Continental Rifts
Many big cities arose on the shores near Continental Rifts, where the tectonic plates are sliding along each other. The slow moving plates cause increasing tensions between the plates. Once in a few years 'stick-slip' occurs between the plates, due to the forces that the plates are exercising on each other. We call this an Earthquake.
Regions that already proved to be at high risk are:
- Santiago in Chile,
- the West-coast of the U.S.A and Alaska,
- Indonesia and Japan.
There are also many other area's lying near rifts that are at a high potential risk of a very heavy Earthquake.
Cities arose along rifts in periods when no one was realizing the risks of heavy Earthquakes.
Earthquake History - Release of Enormous Amounts of Energy
Years
| Energy (ExaJoule)
| Remarks
|
|---|---|---|
1900-1910
| 1,779
| |
1911-1920
| 1,922
| |
1921-1930
| 2,149
| |
1931-1940
| 2,626
| |
1941-1950
| 3,035
| |
1951-1960
| 20,042
| Mainly caused by Chile in 1960
|
1961-1970
| 6,899
| Mainly caused by Alaska in 1964
|
1971-1980
| 2,105
| |
1981-1990
| 1,444
| |
1991-2000
| 2,425
| |
2001-2010
| 7,453
| Mainly caused by Sumatra in 2004
|
2011-2013
| 3,383
| Mainly caused by Japan in 2011
|
Wandering Poles
According to Hapgood's theory, earth crust shifts are caused when the imbalance of the Earth crust, through unsymmetrical deposition of land ice around the poles, exceeds a certain weight. Wandering poles could be a sign of this growing imbalance.
Plate Tectonics doesn't explain sufficiently the tremendous energy that is generated by Earthquakes.
The ruling theory is that the Earth's magnetic field is caused by the liquid outer core, where magnetic minerals are 'whirling' around the Earth's solid inner core. This theory is only a presumption based upon what scientists think - it is impossible to verify this theory.
Wandering North Pole

Wandering South Pole

YEAR
| SP Latitude
| SP Longitude
| NP Latitude
| NP Longitude
| SHIFT SP (km)
| SHIFT NP (km)
|
|---|---|---|---|---|---|---|
1900-1950
| 143,546
| -67,888
| 259,141
| 74,638
| 714,0
| 525,0
|
1950-2000
| 138,303
| -64,661
| 250,36
| 80,972
| 716,0
| 6101,0
|

The Polar Stretch Theory
The North pole and South pole seem to wander randomly, independently from each other, but this wouldn't be logical, because natural laws will try to keep Earth's magnetic field in balance.
Wandering poles must have its consequences on the tensions in the Earth's crust, the so called Polar Stretch Theory. No, this is not an official theory, it's Buildrep's theory!
The Earth magnetic field is a tangle of torus-shaped flux lines, with one resultant North and one resultant South pole.
The essence of the Polar Stretch Theory is that wandering of the poles is an expression of tensions and movements that are going on inside the Earth.
To imagine how the Polar Stretch Theory works - in the Earth's core is a bar magnet that is an unbreakable part of the Earth, connected with the inner core and the crust. It can only twist along its own axis. When everything is in balance the magnet won't be distorted nor bent by the inner or outer forces of the Earth.
When there are tensions or pressures somewhere in the Earth, this magnet will be distorted or bent which results in a moving North pole and/or South pole. When tensions are building up the poles keep moving, meaning that the bar magnet is further bent or distorted, until through an Earthquake this bending force is released, that will partly result in restoring the original shape of the bar magnet.
I used the database of NGDC, that contains for every year the Longitude and Latitude of both the South pole and North pole, from 1590 up to 2015. I mixed these data with the earthquake data and performed all kinds of mathematical tricks with this.
Year
| Lon SP
| Lat SP
| Lon NP
| Lat NP
|
|---|---|---|---|---|
'93
| 138,798
| -64,836
| 255,38
| 78,665
|
'94
| 138,764
| -64,812
| 255,05
| 78,854
|
Example of two locations where the poles are in two consecutive years that gave a positive result, meaning that the poles were wandering from each other.
Using the great circle formula to calculate the shortest distance between the two points ('94-'93) results in this specific example in 32.13 km, which means that from '93 to '94 the shortest distance in one year grew. From all the years, from 1590 up to 2013 I calculated this pole-to-pole wanderings and recorded this in a spreadsheet.
Year
| Lon SP
| Lat SP
| Lon NP
| Lat NP
|
|---|---|---|---|---|
'73
| 139.474
| -65.853
| 259.225
| 76.044
|
'74
| 139.498
| -65.795
| 259.293
| 76.098
|
Example of two locations where the poles are in two consecutive years that gave a negative result, meaning that the poles were wandering towards each other.
This example of the relative pole wandering from '73 to '74 resulted in -8.02 km, meaning that the poles over the shortest distance were wandering towards each other.
This is How it Looks Like

Data Analysis - Relation Between Poles and Earthquakes
There are sources that claim to have found a relation between pole wanderings and earthquakes. But they are wrong, because they compare Richter's scale with the wanderings, and this results in the purest nonsense.
For example the great Earthquake in Chile in 1960 released 8,442 times more energy than the great Earthquake in 1968 in California. When these two are counted as just one Earthquake they would be treated as equal, while they are not, which means that these methods as mentioned above are comparing apples with oranges.
This is what I did:
- I downloaded from the USGS site in several batches an immense amount of data - nearly 25,000 Earthquakes larger than 5.5 Magnitude from 1900 to 2013.
- I added to this list the biggest earthquakes between 1590 and 1900.
- From every Earthquake in this database I calculated the energy. Earthquakes beneath 5.5 are from energetic point of view not interesting anymore.
- From all the Earthquakes in one specific year I summed them all together.
- The right formula to calculate the energy in Joule is: E = 6,3 × 104 × 103M/2. M is the magnitude in Richter. For example the great Alaska Earthquake of Magnitude 9.2 generated: E = 6,3 × 104 × 103×9.2/2= 3.97×10¹⁸Joule.
- I downloaded the pole locations of the North pole and the South pole from the NGDC site and calculated from year to year the relative wandering distances, in the way I explained above.
- I putted both data next to each other, rearranged the Earthquake energy to the same proportions as the pole wandering distance, because the difference in magnitude of these numbers would make graphical analysis useless - the pole wanderings would be a flat line over the x-axis.
This is one big mathematical bag of tricks!
Tsunami's are Caused by Earthquakes in Sea
The Polar Stretch Theory - Explanation of the Data Analysis
The essence of the Polar Stretch Theory is that the extent to which the poles are wandering in regard to each other is a sign that a heavy earthquake is imminent. Isn't that logical?
If you pull on your skin with your fingers, it will shoot loose when the tensions get too big. It's comparable.
The graph below is split into 4 parts. In every division are the poles wandering away from each other and is Earth crust in this period subjected to one ore more heavy Earthquake(s).
After a heavy Earthquake the pole-to-pole wandering seems to stabilize, like the graph is showing.
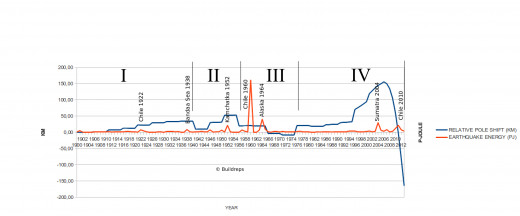
Period I to Period IV
- Period I - The shortest distance from pole-to-pole is increasing, the poles are wandering away from each other (blue line). During the period from 1900 to 1940: average 17,4 km/year. In this period arose two heavy Earthquakes: Chile 1922 and Banda Sea 1938 (peaks in red line). After the Earthquake in Chile the blue line starts to flatten slightly. After the second heavy Earthquake in the Banda Sea the blue line drops dramatically, meaning that in 1940 the pole-to-pole distance nearly stopped to increase.
- Period II - In 1945 the pole-to-pole distance is again increasing, this time with a relative high speed, followed by a very heavy Earthquake in Kamchatka in 1952. This Earthquake seemed to release some of the stress in the Earth crust, which is expressed in stopping the increasing pole-to-pole distance and it even shows a slight decrease.
- Period III - Apparently there was still too much stress in the Earth crust present that caused the great Earthquake in Chile in 1960, followed by the great Earthquake in Alaska in 1964. Both Earthquakes seemed to have released so much stress that the pole-to-pole distance decreased radically and even for a few years the poles were wandering towards each other.
- Period IV - The pole-to-pole distance is again increasing, but this time dramatically fast, followed by the very heavy Earthquake on the other side of the Globe near Sumatra in 2004, followed by the heavy Earthquake near Chile in 2010. The shortest pole-to-pole distance seems to stabilize again due to mainly the Earthquake in Sumatra. The poles are quickly wandering towards each other, expressed in the dropping blue curve. What the effect is of the heavy Earthquakes in Chile in 2010 and Japan 2011 cannot be determined at the moment, but both Earthquakes are (again) lying in the same direction caused by the centrifugal force of Antarctica.
 consequences.")
Conclusion
The Polar Stretch Theory, is worth looking into more deeply. There are patterns that show clear relations.
From 1994 to 2004 the pole-to-pole distance was dramatically increasing, followed by a very fast decreasing. The relaxation must have been caused by the huge earthquake of Sumatra.
It looks like there is a huge earthquake slumbering beneath the crust!
Where will it strike? In Chile.
When? In 2015 or in 2016.
© 2014 by Buildreps
© 2014 Buildreps


