Plotting coordinates. How to plot positive and negative coordinates onto a grid. Worked examples with solutions.

In order to plot a coordinate point on a grid, first you need to understand that the first number of a coordinate is the x coordinate number and the second number of a coordinate is the y coordinate number (x coordinate number, y coordinate number)
So if your point is (-4,0) then -4 is the x coordinate digit and 0 is the y coordinate digit.
Make sure you understand this before you start plotting coordinates onto a coordinate grid.
Example 1
Plot the coordinate (-4,7) onto a coordinate grid.
First put your finger on -4 on the x axis. Make sure you have moved along the x axis not the y axis (the x axis is the horizontal line)
All you need to do now is move up 7 squares as the y coordinate is +7.
Mark the point (-4,7) with a cross or small circle.
Once this is done, you can check that the point is line with -4 on the x axis and 7 on the y axis.

Example 2
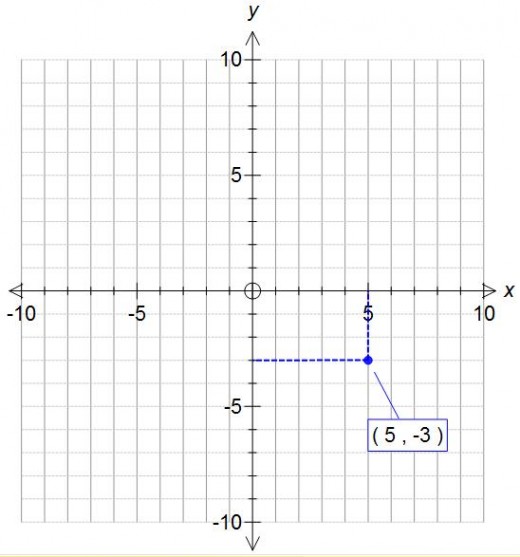
Plot the coordinate (5,-3) onto a coordinate grid.
First put your finger on 5 on the x axis. Make sure you have moved along the x axis not the y axis (the x axis is the horizontal line)
All you need to do now is move down 3 squares as the y coordinate is -3.
Mark the point (5,-3) with a cross or small circle
Once this is done, you can check that the point is line with 5 on the x axis and -3 on the y axis.
This last example involves plotting coordinates where one of the coordinates is 0.
Example 3
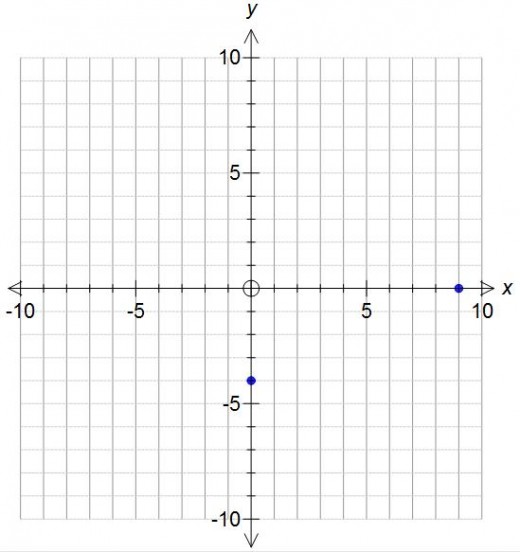
Plot these coordinates onto a coordinate grid:
a) (0,-4)
b) (9, 0)
Answers
a) Go to 0 on the x axis. Now move 4 squares down as the y coordinate is -4.
b) Go to 9 on the x axis. Now don’t move up or down as the x coordinate is 0.
If you always remember that the x coordinate comes first then it’s unlikely you will slip up.

Related

Examples on how to reflect a shape in the x-axis or y-axis on a coordinate grid.
")
How to Use Descartes' Rule of Signs (With Examples)

Reciprocal Graphs. What does a reciprocal graph look like and it's characteristics?

How to Use a GPS: Waypoints and Go-Tos

Cylindrical Coordinates: Rectangular to Cylindrical Coordinates Conversion and Vice Versa


