Bond Yields
Yield Curves
One of the most important tools a bond trader has is the yield curve. A yield curve shows the relationship between the yield to maturity and time to maturity for a set of bonds with similar characteristics.
In this hub, we will look at the factors that give yield curves their particular shapes. We will then see how we can use this knowledge to make financial decisions.
The Shape of Yield Curves
The shape that yield curves take are usually described using the terms normal yield curve, inverted yield curve, and flat yield curve.
When yield increases with maturity, the yield curve is called rising or normal. When yield declines with maturity, the yield curve is called inverted. When yield is constant across maturities, the yield curve is called flat.
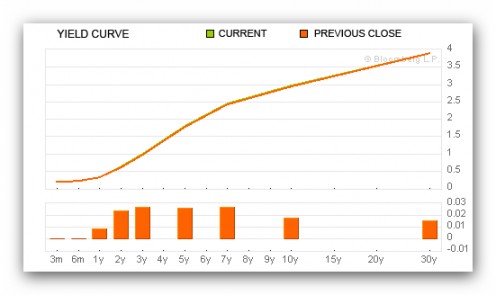
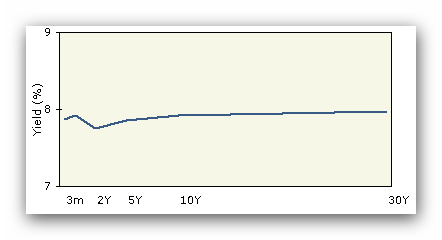
The first yield curve is the bond yield for US Treasuries (government bonds) from 3 months to 30 year maturities. The shape is fairly normal as it rises fairly evenly over the period of thirty years.
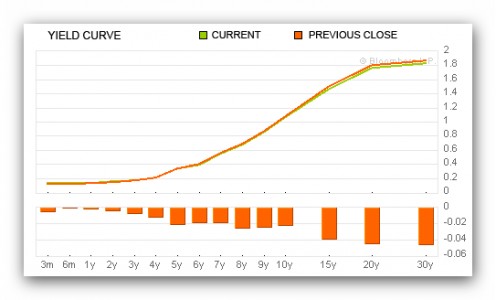
However, the second yield curve of Japanese government bonds shown here has slightly different characteristics. Notice how the early maturities out to 4 years are flat and then the yield curve takes on a normal shape as the maturities move out to the long term.
All types of yield curves whether they be the yield curve for municiple bonds yield, an interest rate yield curve, government bond yield curve or corporate bond yield curve all have one of the three shapes.
US Government Bonds

Factors that Shape the Yield Curve
The shape of the yield curve is believed to be determined primarily by three factors. Take time now to explore the three theories that explain these factors. No one of them has the whole answer, but together they provide powerful insights into the market’s rate structure.
Expectations theory states that the shape of the yield curve is determined solely by the market's forecast of future short term interest rates. If short term rates are expected to increase, longer term rates should be higher than short term. Similarly, if short term rates are expected to fall, longer term rates should be lower. If no change is expected, longer term rates should be the same. Since rates go up and down, the Expectations Theory by itself might lead us to expect that the yield curve would be inverted as often as it is rising. But this is not the case; the yield curve is usually normal or rising. How can we explain this? Look at the Risk Premium Theory to find out.
The risk premium or liquidity preference theory says that investors demand higher yields for taking higher risks. Since longer term bonds typically present greater risks and therefore call for a greater risk premium the yield curve should rise slightly even if short term rates are expected to remain at current levels. This is why a slightly rising yield curve is also called the "normal yield curve".
The yield curve is often inverted from twenty to thirty years. Why is this so? Proponents of the habitat theory explain this phenomenon by noting that different investors have different liability structures and therefore need different maturities. For investors like pension funds or life insurance companies, long maturity bonds are the best match for their very long term liabilities and actually offer less risk than short maturity bonds. Such investors are therefore willing to accept lower yields for the longest maturity bonds. The longest term U.S. Treasury bond - the 30 year bond - often carries a lower risk premium than the 20 and 25 year bonds. According to the habitat theory, the aggregate liability structure of all investors ultimately determines which bonds have the highest risk premiums and thus the highest yields.
Forecasting Interest Rates
Yield curves provide insight into the market’s view on interest rates and are therefore valuable tools for traders and investors.
The slope of the yield curve is a good leading indicator of economic activity. Because the curve can indicate where investors think interest rates are going in the future, it can point towards their expectations for the economy.
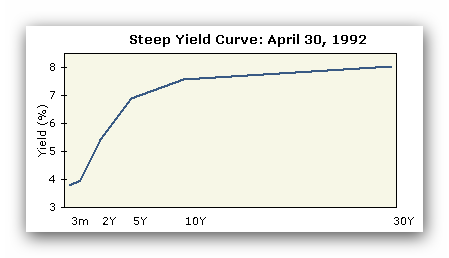
A sharply upward sloping, or steep yield curve, often precedes an economic upturn. The assumption behind a steep yield curve is interest rates will begin to rise considerably in the future. Investors insist on more yield as maturity extends if they expect rapid economic growth because of the associated risks of higher inflation and higher interest rates, which can both hurt bond returns.
As inflation rises, the Federal Reserve raises interest rates to fight inflation.
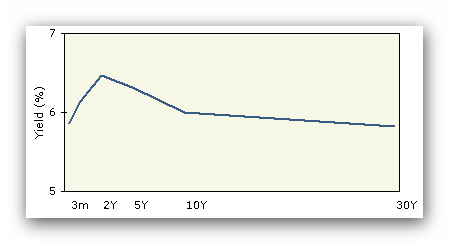
An inverted yield curve usually heralds a recession. When yields on short term bonds are higher than those on long-term bonds, it implies that investors expect interest rates to decline in the future, usually in conjunction with a slowing economy and lower inflation. The yield curve tends to become inverted 12 to 16 months prior to a recession. The yield curve chart above shows an inverted yield curve in early 2000, a year before the American economy went into recession.
A flat yield curve signals an economic slowdown. The curve typically flattens when the Federal Reserve raises interest rates to put the brakes on a rapidly growing economy; short term yields rise to reflect the rate hikes, while long term rates fall as expectations of inflation moderates. A flat yield curve is unusual and indicates a transition to either an upward or downward sloping yield curve. The flat U.S. Treasury yield curve above signalled an economic slowdown prior to the recession of 1990-91.
Benchmarks
In addition to suggesting interest rate trades, the yield curve can be a valuable underwriting tool. Because U.S. Treasury instruments are considered to have no credit risk, they are often used as the benchmark for setting the yields of all other dollar denominated bonds, including corporate bonds, municipal bonds, mortgage-backed bonds and Eurobonds. For example, the approximate yield on a corporate bond will equal the yield on a Treasury bond with the same maturity plus yield allowances for credit risk, call risk, and various other factors.
During the planning stages, a corporate bond underwriter does not need to set the absolute yield for the issue; he need only focus on accurately pricing the “spread over Treasuries” at which the bond should be sold.


