iWork: Numbers Tutorial for Slackers


iTunes, check. iLife, check. iWork...
Yeah, right. iWork. heh heh.
My New Year’s resolution is to grow up a little. Do things that other grown-ups do. Like, learn how to use a spreadsheet and stuff.
So, I went ahead and opened up the disc that came with my Snow Leopard upgrade. You know, the one that usually gets tossed aside and forgotten. The one that says iWork (shudder).
The installer disc served up three applications. One, called Keynote, is a Mac version of PowerPoint. I’ll pretend to create a business presentation later. Looks like fun, kinda.
The second app is called Pages. It looks like a pretty cool word processor. I’m a fan of Bean myself, but I’ll soon be converting my .bean files into Pages. The other grown-ups seem to be doing that.
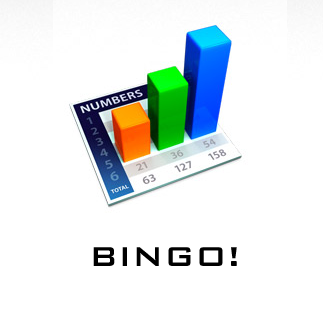
Numbers, the third app, is the one I was looking for. It’s icon is a cool looking bar graph that is springing up from a square chart. It reminds me of playing bingo a little bit.
Once I had it launched, I started to noodle around. Freestyle clicking is the preferred method of self-taught geniuses, you know. It’s the best way to tailor the lessons to your own personal (short) attention span.
Here is what I learned.
Spreadsheets have lots and lots of little boxes. You can put numbers in the boxes, or you can type words. It seems like a good way to make a list of stuff because the list can go left to right, and up and down too.
At first, a spreadsheet looks like a Battleship grid, but you can’t put numbers in random spots like you’re trying to bomb a carrier. That messes up your list.
My favorite part of the spreadsheet is the "charts" button at the top of the menu. It takes all those little boxes, and makes them into a sweet graph.
iScrewAround
My boss tells me sometimes that I should quit screwing around. How does he know? He is a Math Guy, so I think he maybe has a chart or something.
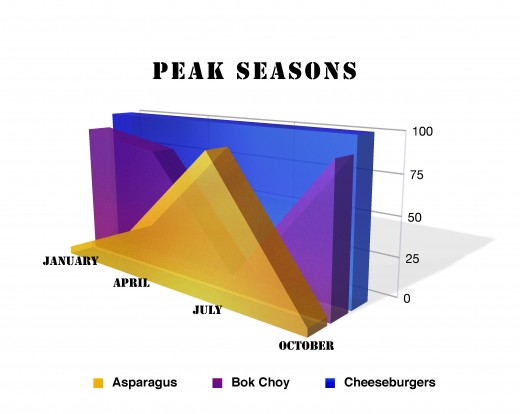
In honor of my 2010 resolution, I decided to make a graph of my home studio productivity.
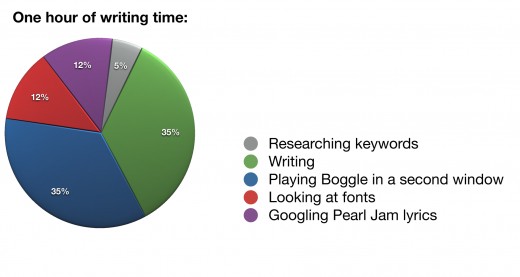
Based on the statistical analysis, there is a high probability that I’m just totally screwing around.
The most interesting result of my experiment is that I found both “hub” and “pages” on the same Boggle board. It was during Round 3.
iSee...
It turns out that you can use a spreadsheet to actually do math for you. The boxes can do calculations to the numbers you put in. It’s algebra-ish.
I clicked around for awhile and decided that it’s easier to do my own calculations. With a calculator. Then type in the numbers.
But, I still used the spreadsheet to put all the numbers in a neat list. Then I clicked my new favorite button: charts.
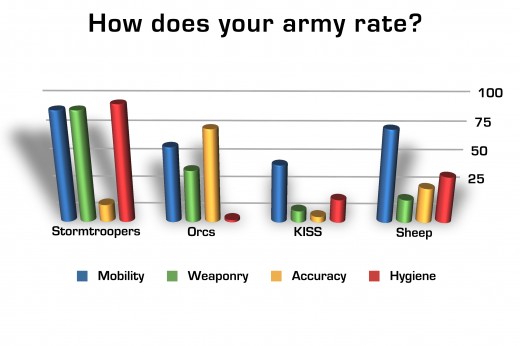
iAyeAye
Analyzing armies is surprisingly complex.
Since I had to take basic algebra twice in high school, I thought I’d try the Spreadsheet Calculator Thingy a second time too. A simpler equation made all the difference in the world.
iStats
Fantasy football stats are something that I can understand fairly easily. If I do screw them up a little, I can usually skate by using my “Only Girl in the League” excuse.
My motto is, If a girl owns a truck, she damn well better know how to drive it. Still, I’d rather pull out my Girl Card than to admit how very bad I am at math.
What makes football stats easier to understand than stats that are actually important? My only conclusion: beer.
I cracked one open, then did a spreadsheet with meaningful data.
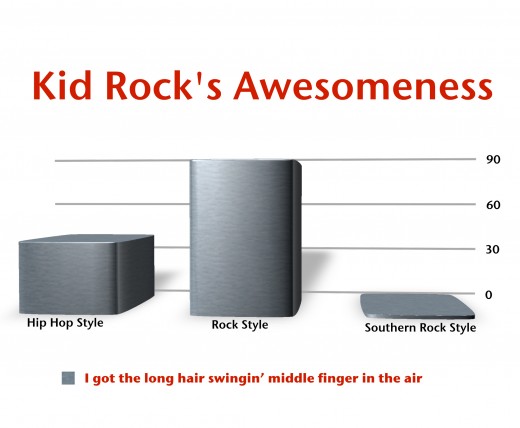
iRock
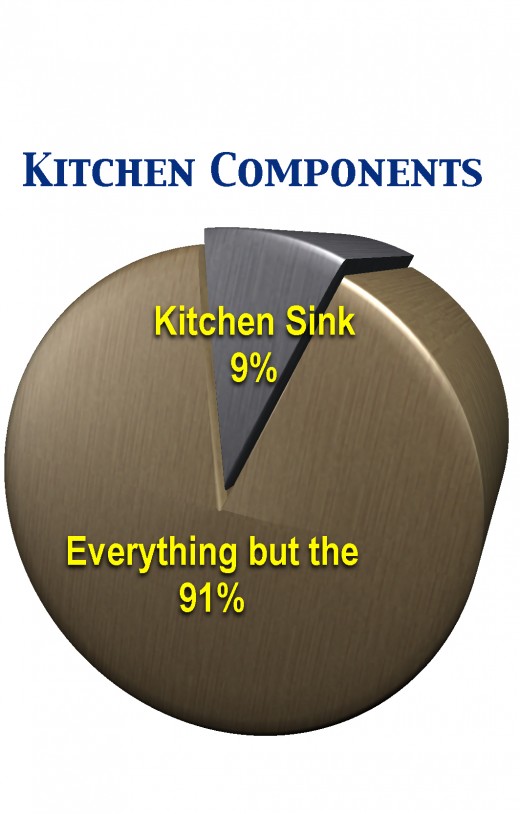
I’m a Michigan girl. Mitten full of fishermen. America’s High Five state.
As a resident of Wayne County, I’ve noticed a disturbing trend first hand. The social implications are yet to be understood.
Adapt or Die, they say. I’m not going to let this one go, though. Sorry.
Watergate DOES bother me.
Wrap it up already, slacker
Admittedly, my freestyle self-training of iWork has left me with a few knowledge gaps. That is bound to happen. When my attention span recovers, I’ll go ahead and figure out the finer, more subtle points.
Maybe I’ll list them in a spreadsheet...

© 2010 wyanjen at HubPages
iWork Tutorial for Slackers


