Identify bullish reversal pattern and bearish reversal pattern through engulfing

Identify reversal pattern through engulfing
As mentioned in my previous hub of candlestick pattern as charting tools for stock investment, there are 12 major candlestick patterns that a stock trader should know in order to trade well using technical analysis. In previous hub, I already introduced Doji candlestick patterns variation and hammer candlestick patterns variation. I also shown examples on how to use doji candlestick variation and hammer candlestick variation to identify potential bullish reversal and bearish reversal. For this hub, I will be sharing about one of the most important candlestick patterns, which is engulfing pattern. I will be covering bullish engulfing pattern as well as bearish engulfing pattern with real stock example.
Bullish Engulfing pattern:
This is one of the most important candlestick patterns as it is indicating almost the end of substantial downtrend of a stock. It is also indicating a complete change in the sentiments of the stock and leaning towards bullish side. Most of the time, it will be accompanied by high volume as well. Once spotted, traders will need to monitor very well the next day trading price action as most likely the price will go up. To identify bullish engulfing pattern, below criteria applied:
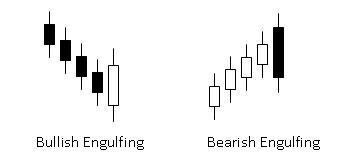
a.) Consist of two day candlestick with second day body engulf the first day body completely
b.) Both the top and the bottom of the candlestick must not be equal
c.) First day candlestick body must be black color while the second candlestick must be white color
d.) Must be occurred after stock had been in downtrend for sometimes
Below example is showing how significant it is to spot the occurrence of bullish engulfing as bullish reversal pattern.
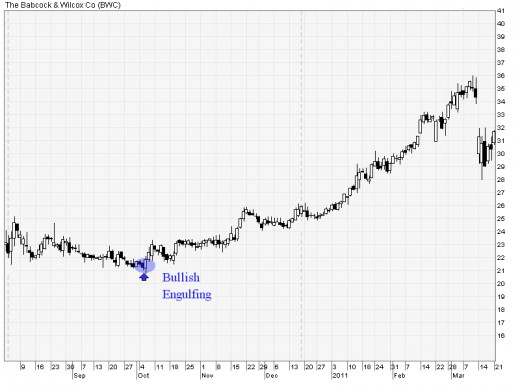
Let us look at The Babcock and Wilcox Co. (BWC) listed in NYSE in August 2010 as example. After listing, the price started to go downtrend until 6 Oct 2010 where we spotted bullish engulfing. The next day, price started to show uptrend and the uptrend was continued from USD 21.24 until USD 35.60 before bear took the action. Imagine a trader who bought BWC at USD23, that was a few days after spotted bullish engulfing, he would had made more than 50% profit. A trader who is able to spot bullish engulfing will definitely have an advantage in stock trading.
Bearish Engulfing pattern:
Similar to bullish engulfing pattern, this candlestick pattern is also indicating complete change of sentiment, but only on the reverse side. Most of the time, it will be accompanied by high volume as well. When bearish engulfing occurred, price will normally begin with higher price. Due to selling pressure was too intense, the stock unable to sustain, thus plunged down. This will formed a long body black candlestick. To summarize, below criteria is applied in identifying bearish engulfing pattern:
a.) Consist of two day candlestick with second day body engulf the first day body completely
b.) Both the top and the bottom of the candlestick must not be equal
c.) First day candlestick body must be white color while the second candlestick must be black color
d.) Must be occurred after stock had been in uptrend for sometimes
Below example is showing how bearish engulfing can be used to spot the bearish reversal pattern.
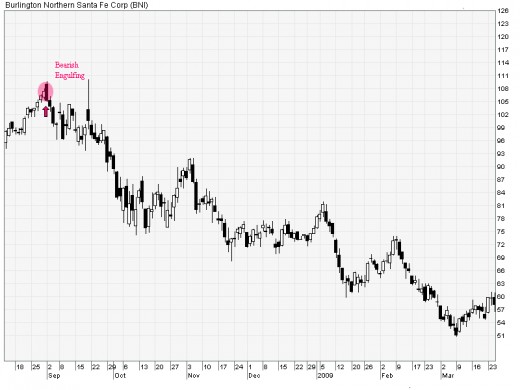
Let us look at Burlinton Northern Santa Fe Corp as the example. After price had been in uptrend from 13 August 2008, bearish engulfing pattern was spotted on 2 September 2008. The next day, price started to move downwards and the down trend continued from USD105 until USD71. A trader will lost around 30% of invested money if he was not aware of the bearish engulfing pattern.
Summary
From 2 examples above, it is observed that how we can actually utilizing bullish engulfing pattern and bearish engulfing pattern in order to predict potential price movement. Knowing how to spot engulfing pattern will be able to give any trader substantial advantages in dealing with stock investment.
Disclaimer
The content of this hub is purely for educational purpose only and cannot be taken as an advisory service or market prediction. There are a lot of factors impacting whether the stock price will go up or down.