- HubPages»
- Technology»
- Computers & Software»
- Computer Science & Programming»
- Programming Languages
Drawing Circles in Javascript - part 4 in a series
Background Principals
First, let's review a little basic trigonometry. If 'r' is the radius of a circle, and 'a' is an angle, r x cos(a) is the x coordinate of a point on the perimeter of that circle, and r x sin(a) is the y coordinate of that same point.
We can draw a circle, by drawing a bunch of short lines from the point at the angle 'a' to the point at 'a + a small change in angle' all of the angles between 0 and Π radians. For example, if you choose "a small change in angle" to be Π/6, the circle would look like a hexagon.
Anyway, the point is to make the lines around the edge of the circle numerous enough that the circle looks smooth. Since our maximum resolution on a computer screen is a pixel, the edge of the circle will never be completely smooth, but it can get close enough to fool your eye into seeing a circle.
These are the principals I used to render a circle, using java script, and a bunch of HTML "div" tags, below.
javascript circle
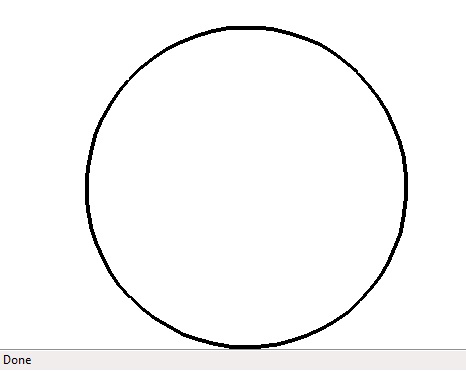
comments on drawing a circle in Javascript
There is a certain amusing irony to making javascript draw in circles. There also interesting points to be made about drawing circles both in regard to programming and Mathematics.
I will use small rectangles, from a previous hub, to draw lines.
I will use line drawing, from a previous hub, to render the circle on the screen.
I will use coordinate mapping, also from a previous hub, so that I can make the simplifying assumption that I am drawing a unit circle (radius of one unit).
Programming is like that, small steps accumulate until you have enough tools to do something bigger.
There are many ways to interpolate the points on a curve in order to render the curve on graph, or simply to provide some other computer processable representation of the curve. The method I chose is obvious, and straight forward. I simply compute two adjacent points on the curve, and draw a line between them. This usually works well enough when the adjacent points are reasonably close on the screen. I did optimize this slightly. I compute an adjacent point further down the curve until I find two with different screen coordinates, before drawing a line.
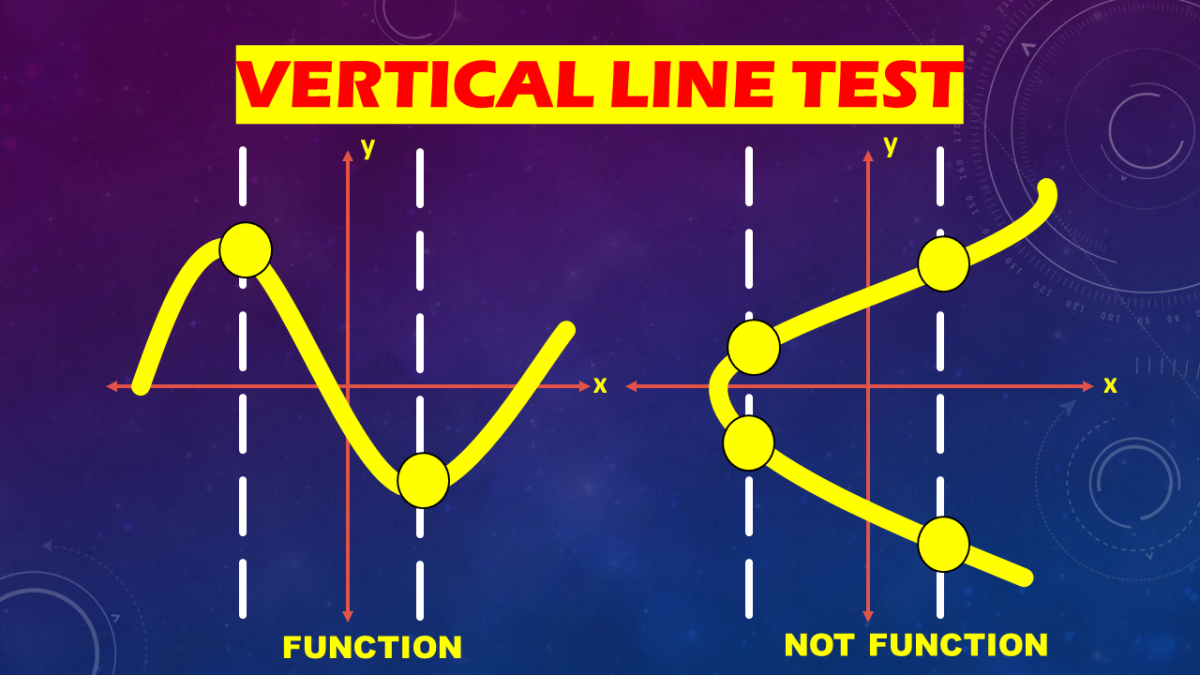
The function, drawcurve, performs the selection of points to interpolate, and renders the lines between them. Its first argument is a function that computes a path in two dimensions. Here the javascript term "function" and its mathematical counterpart mean slightly different things. The mathematical meaning of a function in 2 dimensions is that given an x value, the function will have a unique y value. Given that definition, a circle can't be described by a 2-d function. So, I use a path function; given a distance along a path, return the x and y value of the point on the path, at that distance. A circle is a path in 2-d space.
The actual formula for the path requires me to recall some trigonometry. The projection of an angle along the x axis is cos(x), and sin(x) for the projection onto the y axis.
With that, here goes!
javascript code for drawing a circle
<html>
<head>
<style type="text/css" >
.whiterectangle { color: white; background-color: white; z-index: 0;}
.blackrectangle { color: black; background-color: black; z-index: 1;}
</style>
<script type="text/javascript" >

var jgpointbase = {
	x: 0,
	y: 0
};

function jgpoint( ) {
	this.prototype = jgpointbase;
	//this.x = x;
	//this.y = y;
};

function jgptsc( x, y ) {
		var rval = new jgpoint( );
		rval.x =  this.screenx0 + (( this.screenx1 - this.screenx0 ) / ( this.x1 - this.x0

)) * ( x - this.x0 );
		rval.y =  this.screeny0 + (( this.screeny1 - this.screeny0 ) / ( this.y1 - this.y0

)) * ( y - this.y0 );
		return( rval );
}

var jgcoordinatesbase = {
	x0: -1.25,
	screenx0: 50,
	y0: -1.25,
	screeny0: 450,
	x1: 1.25,
	screenx1: 450,
	y1: 1.25,
	screeny1: 50,
	pointToScreenCoordinates: jgptsc
};

function jgcoordinates() {
}

jgcoordinates.prototype = jgcoordinatesbase;


function drawrectangle( myclass, top, left, width, height )
{
	var bodylist = document.getElementsByTagName( "body" );
	var rect = document.createElement( "div" );
	var mystyle = 'position:absolute;top:' + top + ";left:" + left + ';width:' + width +

";height:" + height;
	rect.setAttribute( "class", myclass );
	rect.setAttribute( "style", mystyle );
	bodylist[0].appendChild( rect );
}

function drawline( width, x1, y1, x2, y2 )
{
	var x, y, nexty, nextx;
	x1 = Math.round( x1 );
	y1 = Math.round( y1 );
	x2 = Math.round( x2 );
	y2 = Math.round( y2 );
	// ensure x1, y1 is leftmost point
	if( x1 > x2 ) {
		tmp = x2;
		x2 = x1;
		x1 = tmp;
		tmp = y2;
		y2 = y1;
		y1 = tmp;
	}
	var dx = x2 - x1;
	var dy = y2 - y1;

	if( dy == 0 ) { // horizontal line
		drawrectangle( "blackrectangle", y1 - width / 2, x1, dx, width );
		return;
	} else if ( dx == 0 ) { // vertical line
		drawrectangle( "blackrectangle", y1, x1 - width / 2, width, dy );
		return;
	}
	var slope = dy / dx;
	if( slope > 1 || slope < -1 ) {
		// one x per multiple y
		if( y1 < y2 ) {
			y = y1;
			for( x = x1 ; x < x2 ; x += 1 ) {
				nexty = y + slope;
				drawrectangle( "blackrectangle", y, x - width / 2, width, nexty - y

);
				y = nexty;
			}
		} else {
			y = y1;
			for( x = x1 ; x < x2 ; x += 1 ) {
				nexty = y + slope;
				drawrectangle( "blackrectangle", nexty, x - width / 2, width, y -

nexty );
				y = nexty;
			}
		}

	} else {
		// one y per multiple x
		if( y1 < y2 ){
			x = x1;
			for( y = y1 ; y < y2 ; y += 1 ) {
				nextx = x + 1 / slope;
				drawrectangle( "blackrectangle", y - width / 2, x, nextx - x, width

);
				x = nextx;
			}
		} else {
			x = x2;
			for( y = y2 ; y < y1 ; y += 1 ) {
				nextx = x + 1 / slope;
				drawrectangle( "blackrectangle", y - width / 2, nextx, x - nextx,

width );
				x = nextx;
			}
		}
	}


}

function jgcircle( angle ) {
	var rval = new jgpoint();

	rval.x = Math.cos( angle );
	rval.y = Math.sin( angle );
	return( rval );
}

function drawcurve( curvefn, coord, fnstart, fnstop, delta ) {
	var pt;
	var fofpt;
	var screenpt, newscreenpt;

	fofpt = curvefn( fnstart );
	screenpt = coord.pointToScreenCoordinates( fofpt.x, fofpt.y );
	for( pt = fnstart + delta ; pt <= fnstop + delta ; pt += delta ) {
		fofpt = curvefn( pt );
		newscreenpt = coord.pointToScreenCoordinates( fofpt.x, fofpt.y );
		if( screenpt.x != newscreenpt.x || screenpt.y != newscreenpt.y ) {
			drawline( 4, screenpt.x, screenpt.y, newscreenpt.x, newscreenpt.y );
			screenpt = newscreenpt;
		}
	}
}
</script>
</head>
<body>
<script type="text/javascript" >
drawrectangle( "whiterectangle", 0, 0, "100%", "100%" );  // make a background rectangle, not

necessary with default browser settings
var unitsquare = new jgcoordinates();
startpoint = unitsquare.pointToScreenCoordinates( -1, -1 );
endpoint = unitsquare.pointToScreenCoordinates( 1, 1 );
drawcurve( jgcircle, unitsquare, 0, 2 * 3.1415929, 0.1 );
</script>
</body>
</html>
Links to previous hubs in this series
- Change of coordinates in Javascript: part 3 in a series
The same line; two different mappings to the screen The previous article in this series covered drawing lines in Javascript. This article adds another tool, mapping of coordinates. It often comes up that... - Drawing Lines in Javascript - part 2 in a series
My last hub showed how to draw rectangles using Javascript. This hub will make use of that capability to draw lines. There was a comment on my earlier hub about drawing rectangles in Javascript, that it... - Drawing a Rectangle in Javascript - part 1 in a series
Computer programming constantly uses encapsulation; someone else figures out how to do something, and you just use it without having to worry about the details. Functions are one mechanism for encapsulation,...


