Is Statistical Process Control Applicable to Software Development Processes?

What is Statistical Process Control?
According to Dr. Donald J. Wheeler and David S. Chambers, “SPC is a way of thinking which happens to have some tools attached” [Wheeler, Chambers, 1992]. It was developed in the 1920s by Dr. Walter A. Shewhart to address the problem of variation resulting from the manufacture of physical products, and was popularized in the 1950s by Dr. W. E. Deming. It did have a profound impact within the world of physical product manufacturing, and continues to today.
A main concept is that, for any measurable process characteristic, the notion that causes of variation can be separated into two distinct classes: 1) Normal (sometimes also referred to as common or chance) causes of variation and 2) assignable (sometimes also referred to as special) causes of variation. The idea is that most processes have many causes of variation, most of them are minor, can be ignored, and if we can only identify the few dominate causes, then we can focus our resources on those. SPC allows us to detect when the few dominant causes of variation are present. If the dominant (assignable) causes of variation can be detected, potentially they can be identified and removed. Once removed, the process is said to be stable, which means that its resulting variation can be expected to stay within a known set of limits, at least until another assignable cause of variation is introduced.
This turns out to be a powerful idea since it allows physical product manufacturers to, as Dr. W. E. Deming points out, “Cease dependence on mass inspection,” [Deming, 1982] which dramatically reduces the cost of producing products with high quality (that is, products that meet their specifications).
The Emphasis
In the early 1990s, the SEITM Capability Maturity Model® for Software included SPC as an integral component. These concepts are evident in the Capability Maturity Model Integrated (CMMI®), version 1.2. The following statements from the CMMI for Development, version 1.2 [SEI, 2006] demonstrate the degree of emphasis placed upon SPC concepts:
Under a section titled “Maturity Level 4: Quantitatively Managed”
“Special causes of process variation are identified and, where appropriate, the sources of special causes are corrected to prevent future occurrences.”
Under a section titled “Quantitatively Managed Process”
“Quantitative management is performed on the overall set of processes that produces a product. The subprocesses that are significant contributors to overall process performance are statistically managed. For these selected subprocesses, detailed measures of process performance are collected and statistically analyzed. Special causes of process variation are identified and, where appropriate, the source of the special cause is addressed to prevent its recurrence.”
Under a section titled “Maturity Level 5: Optimizing”
“At maturity level 5, an organization continually improves its processes based on a quantitative understanding of the common causes of variation inherent in processes."
Under a section titled “Optimizing Process”
“In a process that is optimized, common causes of process variation are addressed by changing the process in a way that will shift the mean or decrease variation when the process is restabilized. These changes are intended to improve process performance and to achieve the organization’s established process improvement objectives.”
To support this concept, the Quantitative Project Management (QPM) process area in the CMMI, Specific Goal #2 exhorts “Statistically Manage Subprocess Performance” with Specific Practice 2.2® stating "Apply Statistical Methods to Understand Variation." The CMMI defines a Statistically Managed Process as “A process that is managed by a statistically based technique in which processes are analyzed, special causes of process variation are identified, and performance is contained within well-defined limits.”
Further, CMMI Generic Practice #4.2 states "Stabilize Subprocess Performance" and elaborates with "A stable subprocess shows no significant indication of special causes of process variation. Stable subprocesses are predictable within the limits established by the natural bounds of the subprocess."
Whenever one speaks about the identification of special (or assignable) causes of variation or the understanding of common (or normal or chance) causes of variation, he or she is talking, without question, about the use of SPC since SPC is the only known technique capable of such identification/understanding. The CMMI for Development, version 1.2 uses the term “variation” 83 times, the term “special cause” 39 times, and the term “common cause” 19 times.
Clearly, there is a significant amount of emphasis placed upon SPC within the CMMI. So much emphasis, that an organization cannot exceed a CMMI process maturity level rating of 3 without performing SPC. The CMMI doesn’t emphasize any other measurement and analysis technique to this degree. Essentially, isn’t the CMMI placing SPC on a pedestal as the Holy Grail of Measurement and Analysis Techniques?
Footnotes
SEI™ is a trademark of Carnegie Mellon University.
Capability Maturity Model Integrated® is registered in the U.S. Patent and Trademark Office by Carnegie Mellon University.
CMMI® is registered in the U.S. Patent and Trademark Office by Carnegie Mellon University.
Capability Maturity Model® is registered in the U.S. Patent and Trademark Office by Carnegie Mellon University.
The Uneasy Feeling
A while back, I was working for an organization that had achieved a CMMI Level 3 assessment rating. I started looking into what it would take for us to achieve CMMI level 4 or 5. When I learned that it would require that we perform SPC, it didn’t seem quite right, but I couldn’t put my finger on the reason at that time. The first thing that I questioned centered around the fact that SPC has traditionally been applied to very repetitive processes in physical product manufacturing. Software development processes, and engineering processes in general, are human intensive, knowledge intensive, and less repetitive by nature than those of physical product manufacturing.
It occurred to me that physical product manufacturers have requirements, design, prototype, and test processes, just like software development shops. However, historically SPC hasn't been applied to those engineering processes. Traditionally, SPC was applied to the production process where the “copies” of the finished products are made. Software development organizations have production processes as well. The difference is that software development organizations are manufacturing 1’s and 0’s, and due to the logical nature of their products, for all practical purposes these production processes produce perfect copies every time, with no variation. Consequently, it isn’t useful to apply SPC to software production processes. Since SPC isn’t applicable to a software development organization’s production processes, the only processes to which SPC can be applied is the organization’s engineering processes. This realization gave me an uneasy feeling, but I figured that surely, I just didn’t understand the concepts of SPC well enough. So I decided to do some research with the goal of understanding the reason for the amount of emphasis that the CMMI places upon SPC.
The Warning Signs
This section summarizes what I found as I researched the applicability of SPC to software development processes.
The IEEE Standard Dictionary of Measures to Produce Reliable Software, contains no recommendation for SPC [IEEE, 1998]. I found this interesting.
The Practical Software and Systems Measurement, also contains no recommendation for SPC [DOD, 2000]. Again, I found this interesting.
In Out of the Crisis, Deming explains his famous 14 points. Point 3 states “Cease dependence on mass inspection” [Deming, 1982]. By this, Deming is suggesting that the concepts of SPC be used to remove assignable causes of variation, resulting in stable processes whose performance can be confidently predicted. If the normal variation of those processes is within the desired specifications, then it isn’t necessary to inspect every product coming off the line. Instead, products only need to be spot-checked (sampled) to ensure that the processes remain stable. Deming then goes on to state “We must note that there are exceptions, circumstances in which mistakes and duds are inevitable but intolerable.” By this, Deming is conceding that this technique won’t work in all situations.
In Quality Control Handbook, Juran states “Unfortunately, as is often the case in such matters, Shewhart’s prospectus [of SPC] has become orthodoxy for many of today’s quality control practitioners” [Juran, 1988]. Clearly Juran has reservations about the universal applicability of SPC.
In Metrics and Models In Software quality Engineering, Stephen H. Kan states “However, in software development it is difficult to use control charts in the formal SPC manner. It is a formidable task, if not impossible, to define the process capability of a software development process” [Kan, 2003].
Ian Sommerville, a professor at St. Andrew’s University and author of a graduate-level software engineering textbook, Software Engineering, first quotes Watts Humphrey: “W. E. Deming, in his work with the Japanese industry after World War II, applied the concepts of statistical process control to industry. While there are important differences, these concepts are just as applicable to software as they are to automobiles, cameras, wristwatches and steel” [Sommerville, 2004]. Then Sommerville goes on to state “While there are clearly similarities, I do not agree with Humphrey that results from manufacturing engineering can be transferred directly to software engineering. Where manufacturing is involved, the process/product relationship is very obvious. Improving a process so that defects are avoided will lead to better products. This link is less obvious when the products is intangible and dependent, to some extent, on intellectual processes that cannot be automated. Software quality is not dependent on a manufacturing process but on a design process where individual human capabilities are significant.”
The ISO 9001:2000 standard doesn’t prescribe SPC [ISO, 2000]. I found this particularly interesting since ISO 9001:2000 has its roots in manufacturing where SPC is undeniably applicable.
In Understanding Statistical Process Control, Dr. Donald J. Wheeler and David S. Chambers state “Attribute Data differ from Measurement Data in two ways. First of all Attribute Data have certain irreducible discreteness which Measurement Data do not possess. Secondly, every count must have a known ‘Area of Opportunity’ to be well-defined” [Wheeler, Chambers, 1992]. It turns out that knowing the Area of Opportunity associated with a given chunk of code (software) isn’t easy. I’ll explain below.
On the SEI’s web site, I found a paper entitled “Statistical Process Control for Software.” In it, it states “Control limits become wider and control charts less sensitive to assignable causes when containing non-homogeneous data” [Carleton, 2005]. It turns out that obtaining homogeneous data from a software development process isn’t easy. Again, I’ll explain below.
As can be seen, there exist many “warning signs” scattered throughout literature that counsel us about the incorrect application of SPC, and there exists software measurement guides and standards in which the presence of SPC is notably absent.
The Problems
While reading about the application of SPC to physical product manufacturing processes, I thought about the corresponding application to software development processes, and it became apparent that there exist some fundamental distinctions between these two environments. It also became apparent that these differences pose significant problems with regard to the application of SPC. In this section, I explain what I consider to be the four most significant problems with the application of SPC to software development processes.
Problem #1 – Wide Control Limits
I think that Stephen H. Kan states it best: “Many assumptions that underlie control charts are not being met in software data. Perhaps the most critical one is that data variation is from homogeneous sources of variation” ... “Therefore, even with exact formulas and the most suitable type of control charts, the resultant control limits are not always useful. For instance, the control limits in software applications are often too wide to be useful.” [Kan, 2003]
The lack of data homogeneity that Dr. Kan refers to is the result of the process (more accurately, the set of similar processes) containing multiple “common cause systems.” To understand the concept of a common cause system, consider a manufacturing line for a screw. Iron cylinders are the input to the process. A well-defined set of machining operations occur, and the finished screws are the output of the process. Within this process, all inputs are similar in type (that is iron cylinders) and all of the processing elements are similar (the same operations performed by the same machines). This process represents a single common cause system in which a predictable set of common causes of variation (and possibly some assignable causes of variation) can be expected to exist. Now, suppose we start alternating the inputs between the original iron cylinders and those made of brass. Should we expect the same resulting variation? Of course not. The different metals have different characteristics which will likely result in different variation. Now, our process (more accurately, pair of processes) has two common cause systems present, which, if mixed on a single control chart, will exhibit wider control limits than would be the case if the two different common causes systems were charted independently. The result is control charts with low sensitivity to assignable causes of variation. Additional common cause systems would be introduced if the processing elements were not performed by the same machines every cycle. When the inputs or the processing elements change between process invocations, we no longer have a single “voice of a process,” but rather a conglomeration of voices of many different processes.
Disaggregating data from the process into the distinct common cause systems is the obvious solution, but unfortunately, disaggregating the data from the many common cause systems contained within most software development processes isn't practical. Even if successful in accurately disaggregating the data, the resulting multitude of control charts will likely each contain too few data points to be useful [Raczynski/Curtis, 2008].
Problem #2 – Impossible to eliminate all assignable causes of variation
Think back to the screw manufacturing example. Lets say that a single common cause system was in place (the inputs and processing elements were virtually identical between process invocations). Let us further say that after manufacturing about 200,000 screws, an assignable cause of variation was detected by our control charts. Upon systematic evaluation of the manufacturing line, the assignable cause was determined to be a worn roller within one of the machines. Once the worn roller was identified as the culprit, the assignable cause of the variation was persistently removed simply by replacing the worn roller with a new one.
Is this so simple when the process is human intensive and knowledge intensive? To answer that question, consider some potential causes of variation of a human-intensive, knowledge-intensive processes such as a code inspection. Certainly, process invocations involving different people, with different experience and knowledge levels will show a large amount of variation (because they are different common cause systems). However, even if each invocation of the process involves the exact same people, abnormal variation could result if one or more of the following applies to one or more of the people:
- Just quit smoking
- Didn’t get enough sleep
- Is going through a divorce
- Mom died
- Is under a schedule crunch
- Is bitter due to lack of recognition
- Doesn’t feel well
- Is being bothered by mother-in-law
- Is becoming unsatisfied with job
- Is not familiar with the piece of code being inspected
- Found out that he/she needs surgery
- Is recovering from surgery
- Is feeling depressed
The list goes on and on. If SPC is being applied to a characteristic of this inspection process, and an assignable cause of variation is detected on the control chart, then will it be as easy to systematically analyze the process in order to identify the source of that variation as it was to identify the worn roller in the screw manufacturing example? Of course not. It is much more difficult to identify causes of variation that are human in nature. Even if you do successfully identify the assignable cause of variation, then how easy is it going to be to eliminate that cause to prevent recurrence? Will it be as easy as replacing a worn roller in a machine? Again, of course not, due to the human element. One cannot just open up a person’s head to fix the problem.
Problem #3 – Each Process is Different From Invocation to Invocation
A distinguishing feature between manufacturing production processes and software development processes is the degree of repetitiveness of the processes. Manufacturing production processes create the same product over and over from virtually identical inputs and with virtually identical processing elements from invocation to invocation. In contrast, software development processes aren’t creating the same piece of code over and over. So, the following questions arose: Are all processes alike? Are some processes more repetitive between invocations than others? To help illustrate, I created Table 1.
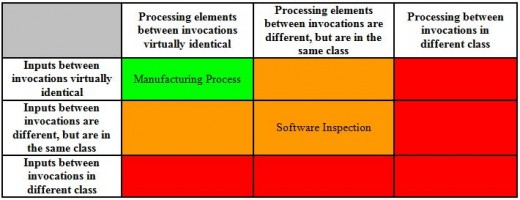
The two characteristics of process invocations that determine whether the different invocations are instances of the same parent process, are instances of different parent processes, or are instances of parent processes that are different, but similar, are the similarity of the inputs and the processing elements between the invocations.
In some processes, the inputs to the process are virtually identical from invocation to invocation, and the processing elements are virtually identical from invocation to invocation.
If, between invocations, either the inputs or the processing elements are completely different, then these different process invocations can hardly be considered instances of the same process.
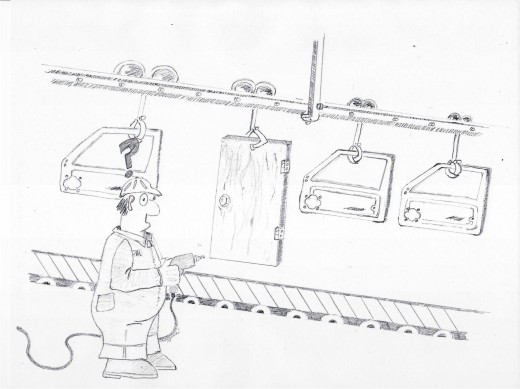
In some processes, however, such as a code inspection process, the inputs are different every time, but are in the same class of objects (that is, code), and the processing elements are different, but again, are within the same class of processing (that is, human understanding of written code). Even though the inputs and processing elements between invocations are in the same class, they are still different from invocation to invocation. Can these invocations be considered instances of the same parent process from a process variation standpoint? If, for example, when we started feeding brass pieces into our screw manufacturing process instead of iron pieces, should we expect the same variation to result? Of course not.
When control charts are used with a manufacturing process, the control limits are re-calculated after a known process change, such as changing the inputs to the process, occurs. Software development processes never have the same inputs between invocations.
Figure 1 is a cartoon that illustrates this concept of “in the same class, but still different” with a touch of humor.
Problem #4 – Can’t Normalize the Data
Recall the prior quote: “every count must have a known ‘Area of Opportunity’ to be well-defined” [Wheeler, Chambers, 1992]. In order to plot attribute data on a control chart, it is necessary to normalize the data using a known area of opportunity.
For the sake of those readers not familiar with the terms “normalization” or “area of opportunity,” consider the following example:
Your business has two cable suppliers, Supplier A and Supplier B. You have been keeping track of the number of defects identified with each supplier’s cable over the course of the last year. Your counts show that 20 defects have been identified in cable coming from Supplier A, and that only 10 defects have been identified in cable coming from Supplier B. Can we say that Supplier B has superior quality than Supplier A? No, because you first need to consider the quantity of cable that was provided by both. In this case, you learned that your company purchased 100,000 feet of cable from Supplier A, and only 10,000 feet of cable from Supplier B in the previous year. The length of the cable represents the area of opportunity. If we divide the defect counts by the area of opportunity, then the resulting values (in defects per foot) are considered to be normalized, and can rightfully be compared. In this example, the quality of cable supplied by Supplier A exceeds the quality of cable supplied by Supplier B by a factor of five.
Unfortunately, quantifying the area of opportunity isn’t so easy with code. Some code is very straight-forward while other code is comparatively much more complex. The area of opportunity of complex code can be much greater than the area of opportunity of straight-forward code, even if the two chucks of code have the same number of logical source lines of code (SLOC) and the same computed complexity value.
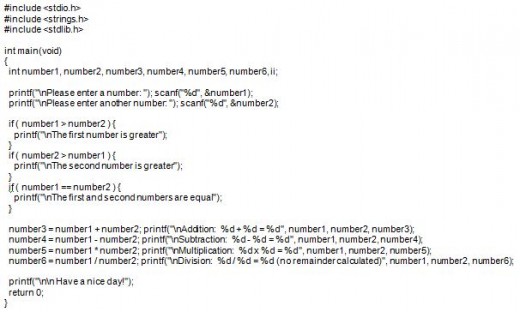
Consider Code Sample A below. Code Sample A includes a few header files, declares a few variables, asks the user to input two numbers, performs some comparisons on those two numbers, performs some simple arithmetic on the numbers, and prints the results. This is a very straight forward program.
Now consider Code Sample B. Code Sample B includes a couple header files, #defines a value, declares a structure and some other variables. After that, Code Sample B becomes rather difficult to understand. It would require even a seasoned programmer a while to figure out what this program is doing due to the complexity and obscurity of the code.
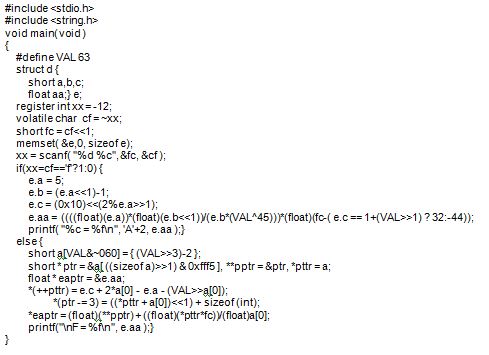
Code Sample A and Code Sample B each contain 31 logical SLOC statements, and both have a McCabe Cyclomatic Complexity value of four.
So what is the area of opportunity for these two code samples? I don’t know. I have no way to accurately quantify the two areas of opportunities. I can only subjectively state that the area of opportunity for Code Sample B is far greater than that of Code Sample A.
In summary, SPC cannot be applied if the data cannot be normalized. The data cannot be normalized if the area of opportunity cannot be quantified. Since the area of opportunity for different pieces of code (software) cannot be accurately quantified, the proper application of SPC to processes which operate on code isn’t feasible.
So, Can SPC be applied to Software Development Processes?
Well, if you do apply SPC to software development processes, you might occasionally get lucky and detect a real assignable cause of variation despite the wide control limits of your control charts, the unequal area of opportunities, and the ever-changing processes. Of the assignable causes of variation that you do manage to detect, you might occasionally get lucky and actually identify one of the causes of that variation. Of the very few assignable causes of variation that you manage to identify, one of them might occasionally be of a nature in which it can actually be removed with some persistence. Even so, the overall system will hardly be more predictable.
Given that SPC has been prescribed by the CMM and CMMI for over a decade, I expected to find hundreds, if not thousands of peer-reviewed publications that demonstrate the use of SPC to successfully improve software development processes. During my research, I did find a few examples of SPC applied to software development processes, but one thing that I noticed in those articles is that they generally failed to detect, identify, and remove with persistence, assignable causes of variation in the process. Instead, they seemed to focus on the method of SPC, the data homogeneity issues, and attempts to resolve those issues. The processes under study were left unimproved.
Are there better alternatives?
I have found that there are other measures and indicators that have proven more useful than SPC. For example, I was surprised how many organizations analyze the heck out of their inspection process, yet they have no idea what percentage of their total code is actually being inspected. My experience is that many organizations only inspect a very small portion of the code that they produce. What good is all that analysis going to do the organization if only 10% of the code that goes out the door is being inspected? Michael Fagan got it right [Fagan, 1976]. If you perform work product inspections, you will identify defects earlier, and will save money, even if those inspections aren’t being performed at the highest level of optimization possible. I have found that an inspection coverage goal and indicator against that goal is very insightful. There are many other useful measures and indicators. Which are the most useful depends on the unique circumstances and needs of each organization.
For predictability of the overall system, I recommend using a parametric modeling tool [Putnam, 1992].
The Other Problem
Recall the following quote from the CMMI for Development, version 1.2:
Maturity Level 5: Optimizing:
“At maturity level 5, an organization continually improves its processes based on a quantitative understanding of the common causes of variation inherent in processes.”
I had a couple of private conversations with Dr. Donald J. Wheeler on the topic of SPC applied to software, and he thought that the above statement was, well, an incorrect use of SPC. In his book, The Six Sigma Practitioner’s guide to Data Analysis, Dr. Wheeler explains why this is incorrect: “Since reengineering a process is never cheap, it should be undertaken only when it is needed” [Wheeler, 2005]. In order to change the common causes of variation, or the “voice of the process,” it is necessary to completely re-engineer the process. Re-engineering a process isn’t cheap. In Dr. Wheeler’s words, "the focus should be on the dominant few, not the trivial many.”
Even if the previously explained problems with applying SPC to engineering processes didn’t exist, this concept of continually improving the processes based on a quantitative understanding of the common causes of variation inherent in processes is simply a flawed understanding of the proper application of SPC.
Conclusion
As with most tools, SPC is useful when applied to the correct job. SPC works very well when used to understand and improve highly repetitive processes, that is processes which have fair amount of consistency with regard to their inputs and processing elements such as manufacturing processes. As should be evident by the problems described within this article, the usefulness of applying SPC to human intensive, knowledge intensive processes like engineering processes is questionable at best. Yes, with enough effort and determination, one can drive a nail with a screwdriver, but that might not be the most efficient or effective use of resources.
The CMMI contains a plethora of true best practices. To be sure, the CMMI and its predecessor models have helped mature the software development community. Like anything, there exists room for the CMMI to be improved. In that spirit of continuous improvement, I have two recommendations to be considered for the next version of the CMMI:
- I recommend that SPC be de-emphasized. Specifically, I recommend the same approach that ISO 9001:2000 took: “… shall include determination of applicable methods including statistical techniques, and the extent of their use” [ISO, 2000]. In other words, ISO 9001 is requiring that organizations think about their unique situations, determine what measurement and analysis techniques make best sense for them, and then apply them. In this way, this ISO quality standard doesn’t mandate the use of SPC or any other measurement/analysis solution for that matter.
- I recommend removing the bit about processes being continually improved based on a quantitative understanding of the common causes of variation inherent in processes. According to Dr. Donald Wheeler, this isn't the correct application of SPC. Not even when applied to manufacturing processes.
Acknowledgments
The author is grateful for the feedback on a previous version of this paper from Bob Kierzyk of Motorola, Jeff Norkoli, Jack Parran, Mike Mabry, and Jim Kirk of Lockheed Martin. Judy Bamberger of Process Solutions also provided helpful insight into the history of the CMMI, and into the politics behind maturity levels 4 and 5. Much thanks to Dr. Stan Rifkin, who helped to frame the issues and improve the emphasis and to Dr. Bill Curtis who partnered with me to write a Point/Counterpoint article regarding SPC and its applicability to software development processes. Finally, a special thanks to Dr. Donald J. Wheeler for taking the time to hold conversations with me on the topic of SPC applied to software development processes, and for providing his insight on the subject.
References
[Wheeler, Chambers, 1992] Donald J. Wheeler, David S. Chambers. Understanding Statistical Process Control, Second Edition. SPC Press, 1992.
[Deming, 1982] W. Edwards Deming. Out of the Crisis. MIT CAES, 1982.
[IEEE, 1998] IEEE. IEEE Standard Dictionary of Measures to Produce Reliable Software, IEEE Std 982.1-1988.
[DOD 2000] Department of Defense and US Army. Practical Software and Systems Measurement. Version 4.0b. October 2000.
[Juran, 1988] J. M. Juran. Juran’s Quality Control Handbook, Fourth Edition. McGraw Hill, 1988.
[Carleton, 2005] Anita Carleton. Statistical Process Control for Software. URL: http://www.sei.cmu.edu/str/descriptions/spc_body.html. Last Modified: 14 December 2005
[Kan, 2003] Stephen H. Kan. Metrics and Models in Software Quality Engineering, Second Edition. Addison Wesley, 2003
[Sommerville, 2004] Ian Sommerville. Software Engineering, Seventh Edition. Addison Wesley, 2004
[ISO, 2000] ISO. Quality Management Systems - Requirements, Third Edition, ISO 9001:2000(E)
[Wheeler, 2005] Donald J. Wheeler. The Six Sigma Practitioner’s Guide To Data Analysis. SPC Press, 2005.
[SEI, 2006] Software Engineering Institute (SEI). Capability maturity model integrated (CMMI) for Development, Version 1.2. CMMI-DEV, V1.2, CMU/SEI-2006-TR-008, ESC-TR-2006-008. August 2006.
[Putnam, 1992] Lawrence H. Putnam, Ware Myers. Measures For Excellence, Prentice Hall PTR, 1992.
[Fagan, 1976] Fagan, M.E., Design and Code inspections to reduce errors in program development, IBM Systems Journal, 1976, Vol. 15, No 3, pp. 182-211
[Raczynski/Curtis 2008] Bob Raczynski and Bill Curtis. Software Data Violate SPC’s Underlying Assumptions, IEEE Software, May/June 2008, Vol. 25, No. 3, pp. 49-51
Letter From Dr. Donald J. Wheeler
After I wrote this article, I sent it to Dr. Donald J. Wheeler as he is one of the world's leading authorities on the subject of Statistical Process Control. His response is copied below.
--- On Mon, 4/20/09, Donald J Wheeler <djwheeler@spcpress.com> wrote:
From: Donald J Wheeler <djwheeler@spcpress.com>
Subject: Re: Published SPC Article
To: bobraczynski@yahoo.com
Date: Monday, April 20, 2009, 12:48 PM
Bob,
Thanks for the article. While I am always slow to say that there is any area where we cannot use SPC profitably, I have to agree with you.
Think about the job of writing books. I do not use SPC there. And I have the advantage of being one person, with presumably only one personality to deal with. You are talking about writing books by a committee.
As I said earlier, I never felt that the SEI really ever got it right. And I have worked with software groups over the years and have never seen any successful applications. While I do not pretend to understand all of the issues for my various clients, and while I sometimes am surprised at how they the manage to use the techniques I have taught them, I do generally find that when SPC can be used successfully, my students will manage to do so.
I have to agree with each of your points. They are exactly the points on which the application breaks down. (By the way, I do not know that I have ever written two sentences like the two previous sentences about an article sent to me. I have certainly never done so in review work.)
So while SPC is literally a statistical axe with limitless applications, and while the control chart can almost completely replace the whole tool kit of analytical statistics, there are problems where an axe will be of little help. Software development is one of those. Returning to Deming, when the product is one-off, the emphasis will have to be on careful planning and design.
Thanks once again. Keep up the good work.
Don
Donald J Wheeler
Fellow American Statistical Association
Fellow American Society for Quality

