- HubPages»
- Technology»
- Computers & Software»
- Computer Science & Programming»
- Programming Languages
drawing calculus (numerical integration and differentiation) in javascript - part 6 in a series
discussion of drawing calculus in javascript
This hub builds on work done in previous hubs and uses some powerful techniques from both mathematics and programming.
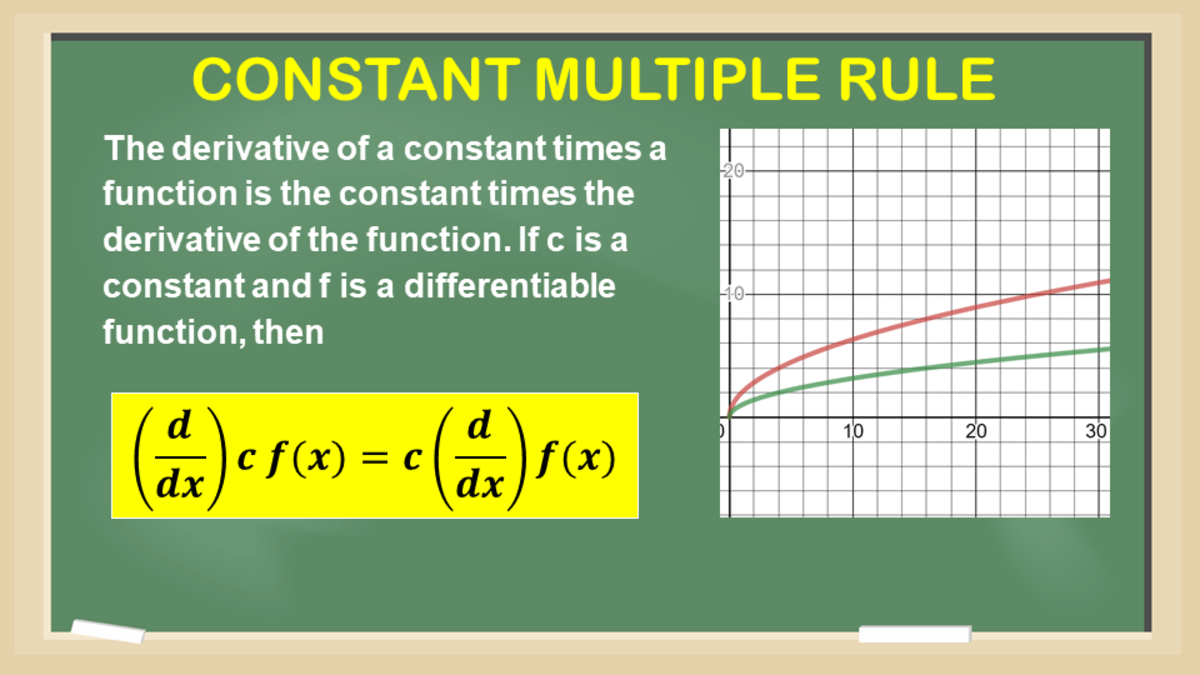
If you recall calculus, derivatives and differentials are defined as limits. A derivative is the limit of a series of approximations of the slope of a curve ( f(x+delta) - f(x) ) / delta. A differential is the limit of a series of approximations of the area under a curve, sum( f( x ) * delta). The Fundamental Theorem of Calculus states that these two operations are inverses of each other. The approximation formulas can themselves be used to perform numberical integration and differentiation. With a reasonably small delta, the result will be pretty close to the theoretical result.
In order to calculate the derivative and differentials for arbitrary functions, I used a feature of javascript called a closure. This just means that a javascriipt function declared within the scope of another javascript function will have access to the parameters and local variables of the function that it was declared within. In this case one of the parameters of the function that creates derivative functions, jgptdiff, is the function to compute the derivative of. The function that returns differential , jgptint, does something similar, and also has some local variables for bookkeeping and to compute the sum of the differential.
I added one more feature. I got tired of calculating the coordinates of what I want to graph. So, I wrote a function to compute the range of a function and adjust the screen coordinate mapping object appropriately, jgcoordinatesbase.scaleToCurve.
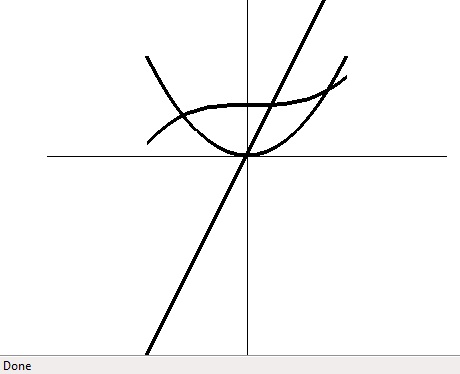
The functions I chose to graph were the derivative of x^2, the integral of x^2, and the derivative of the integral of x^2. The last demonstrates that differentiation and integration are, in fact, inverses. I added some lines to mark the axis of my graph area.
If you take all of this together and are willing to write a small amount of javascript, you now can use your browser as a pretty powerful graphing calculator. There is no need to fork over a hundred dollars, or so, to Sharp, or HP, or Texas Instruments, or whoever is making graphing calculators these days. If later you, or I, add a user interface, this graphing calculator can have an even wider audience.
Finally, I made use of one other famous programming technique, a hack. My definition of a hack is an expedient solution that is not entirely satisfactory and may have adverse consequences to the future maintenance and enhancement of the code. There is a line in the code, rval.y = -( fn( x ).y - fn( x + delta).y) / ( delta );. Negating the difference of the two function values is because I programmed the differentiating function to reset the sum when the x value it was passed is less than the previous x value it was passed. This is expedient. It will probably also cause me grief, once I have forgotten that I have done this and reuse this code in some other context.
I will probably let this topic sit for a while, now, and start another thread in my hubs, then come back to this thread. There are some different directions I could go with it. If any reader wants to give me feedback on which of those directions would be most interesting, I would appreciate the input. The possibilities that occur to me are:
1. Add a user interface to complete the graphing calculator.
2. Explore some methods for using mathematics to describe arbitrary shapes.
3. Prepare graphs to illustrate some interesting mathematics.
code for integration and differentiation
<html>
<head>
<style type="text/css" >
.whiterectangle { color: white; background-color: white; z-index: 0;}
.blackrectangle { color: black; background-color: black; z-index: 1;}
</style>
<script type="text/javascript" >

var jgpointbase = {
	x: 0,
	y: 0
};

function jgpoint( ) {
	this.prototype = jgpointbase;
	//this.x = x;
	//this.y = y;
};

function jgptsc( x, y ) {
		var rval = new jgpoint( );
		rval.x =  this.screenx0 + (( this.screenx1 - this.screenx0 ) / ( this.x1 - this.x0 )) * ( x - this.x0 );
		rval.y =  this.screeny0 + (( this.screeny1 - this.screeny0 ) / ( this.y1 - this.y0 )) * ( y - this.y0 );
		return( rval );
}

var jgcoordinatesbase = {
	x0: -1.25,
	screenx0: 50,
	y0: -1.25,
	screeny0: 450,
	x1: 1.25,
	screenx1: 450,
	y1: 1.25,
	screeny1: 50,
	pointToScreenCoordinates: jgptsc,
	scaleToCurve: function ( curvefn, fnstart, fnstop, delta ) {
		var pt;
		var fofpt;

		// get maximum and minimum x and y values
		fofpt = curvefn( fnstart );
		var minx = fnstart;
		var miny = fofpt.y;
		var maxx = fnstop;
		var maxy = fofpt.y;
		for( pt = fnstart + delta ; pt < fnstop; pt += delta ) {
			fofpt = curvefn( pt );
			if( fofpt.y > maxy ) {
				maxy = fofpt.y;
			}
			if( fofpt.y < miny ) {
				miny = fofpt.y;
			}
		}
		var aspectratio = ( this.y1 - this.y0 ) / ( this.x1 - this.x0 );
		if( this.y0 < miny ) {
			miny = this.y0;
		}
		if( this.y1 > maxy ) {
			maxy = this.y1;
		}
		if( this.x0 < minx ) {
			minx = this.x0;
		}
		if( this.x1 > maxx ) {
			maxx = this.x1;
		}
		var newaspectratio = ( maxy - miny ) / (maxx - minx );
		if( newaspectratio > aspectratio ) {
			// match y values and scale x values
			this.y0 = miny;
			this.y1 = maxy;
			var xlength = 1 / aspectratio * ( maxy - miny );
			this.x0 = minx + (maxx - minx) / 2 - xlength / 2;
			this.x1 = minx + (maxx - minx) / 2 + xlength / 2;
		} else {
			// match x values and scale y values
			this.x0 = minx;
			this.x1 = maxx;
			var ylength = aspectratio * ( maxx - minx );
			this.y0 = miny + (maxy - miny) / 2 - ylength / 2;
			this.y1 = miny + (maxy - miny) / 2 + ylength / 2;
		}
	}
};

function jgcoordinates() {
}

jgcoordinates.prototype = jgcoordinatesbase;


function drawrectangle( myclass, top, left, width, height )
{
	var bodylist = document.getElementsByTagName( "body" );
	var rect = document.createElement( "div" );
	var mystyle = 'position:absolute;top:' + top + ";left:" + left + ';width:' + width + ";height:" + height;
	rect.setAttribute( "class", myclass );
	rect.setAttribute( "style", mystyle );
	bodylist[0].appendChild( rect );
}

function drawline( width, x1, y1, x2, y2 )
{
	var x, y, nexty, nextx;
	x1 = Math.round( x1 );
	y1 = Math.round( y1 );
	x2 = Math.round( x2 );
	y2 = Math.round( y2 );
	// ensure x1, y1 is leftmost point
	if( x1 > x2 ) {
		tmp = x2;
		x2 = x1;
		x1 = tmp;
		tmp = y2;
		y2 = y1;
		y1 = tmp;
	}
	var dx = x2 - x1;
	var dy = y2 - y1;

	if( dy == 0 ) { // horizontal line
		drawrectangle( "blackrectangle", y1 - width / 2, x1, dx, width );
		return;
	} else if ( dx == 0 ) { // vertical line
		if( dy < 0 ) {
			y1 = y2;
			dy = -dy;
		}
		drawrectangle( "blackrectangle", y1, x1 - width / 2, width, dy );
		return;
	}
	var slope = dy / dx;
	if( slope > 1 || slope < -1 ) {
		// one x per multiple y
		if( y1 < y2 ) {
			y = y1;
			for( x = x1 ; x < x2 ; x += 1 ) {
				nexty = y + slope;
				drawrectangle( "blackrectangle", y, x - width / 2, width, nexty - y );
				y = nexty;
			}
		} else {
			y = y1;
			for( x = x1 ; x < x2 ; x += 1 ) {
				nexty = y + slope;
				drawrectangle( "blackrectangle", nexty, x - width / 2, width, y - nexty );
				y = nexty;
			}
		}

	} else {
		// one y per multiple x
		if( y1 < y2 ){
			x = x1;
			for( y = y1 ; y < y2 ; y += 1 ) {
				nextx = x + 1 / slope;
				drawrectangle( "blackrectangle", y - width / 2, x, nextx - x, width );
				x = nextx;
			}
		} else {
			x = x2;
			for( y = y2 ; y < y1 ; y += 1 ) {
				nextx = x + 1 / slope;
				drawrectangle( "blackrectangle", y - width / 2, nextx, x - nextx, width );
				x = nextx;
			}
		}
	}


}

function jgcircle( angle ) {
	var rval = new jgpoint();

	rval.x = Math.cos( angle );
	rval.y = Math.sin( angle );
	return( rval );
}

function jgcos1overx2( x ) {
	var rval = new jgpoint();

	rval.x = x;
	rval.y = Math.cos( 1 / ( x * x ) );
	return rval;
}

function jgptdiff( fn, x, delta ) {
	var rval = new jgpoint();

	rval.x = x;
	rval.y = -( fn( x ).y - fn( x + delta).y) / ( delta );
	//bit of a hack to keep the integration function from reseting
	return( rval );
}

function jgdiff( fn, delta ) {
	var rval = function( x ) {
		return jgptdiff( fn, x, delta );
	}
	return rval;
}

function jgptint( fn, x, delta ) {
	var rval = new jgpoint();

	rval.x = x;
	rval.y = fn( x - delta ).y * delta;
	return( rval );
}

function jgint( fn, delta ) {
	var sum = 0;
	var lastx = 1000;
	var rval = function( x ) {
		if( x < lastx ) {
			// assume new integral, reset
			sum = 0;
		} else {
			delta = x - lastx;
		}
		var pt = jgptint( fn, x, delta );
		sum += pt.y;
		pt.y = sum;
		lastx = x;
		return( pt );
	}
	return rval;
}

function xsquared( x ) {
	var rval = new jgpoint();

	rval.x = x;
	rval.y = x * x;
	return( rval );
}


function drawcurve( curvefn, coord, fnstart, fnstop, delta ) {
	var pt;
	var fofpt;
	var screenpt, newscreenpt;

	fofpt = curvefn( fnstart );
	screenpt = coord.pointToScreenCoordinates( fofpt.x, fofpt.y );
	for( pt = fnstart + delta ; pt < fnstop ; pt += delta ) {
		fofpt = curvefn( pt );
		newscreenpt = coord.pointToScreenCoordinates( fofpt.x, fofpt.y );
		if( screenpt.x != newscreenpt.x || screenpt.y != newscreenpt.y ) {
			drawline( 4, screenpt.x, screenpt.y, newscreenpt.x, newscreenpt.y );
			screenpt = newscreenpt;
		}
	}
}
</script>
</head>
<body>
<script type="text/javascript" >
drawrectangle( "whiterectangle", 0, 0, "100%", "100%" );  // make a background rectangle, not necessary with default browser settings
var unitsquare = new jgcoordinates();
startpoint = unitsquare.pointToScreenCoordinates( -1, -1 );
endpoint = unitsquare.pointToScreenCoordinates( 1, 1 );
jgx2diff = jgdiff( xsquared, 0.01 );
unitsquare.scaleToCurve( jgx2diff, -1, 1, 0.1 );
drawcurve( jgx2diff, unitsquare, -1, 1, 0.1 );
jgx2int = jgint( xsquared, 0.1 );
drawcurve( jgx2int, unitsquare, -1, 1, 0.1 );
jgx2diffint = jgdiff( jgx2int, 0.1 );
drawcurve( jgx2diffint, unitsquare, -1, 1, 0.1 );
yaxis1 = unitsquare.pointToScreenCoordinates( 0, unitsquare.y1 );
yaxis0 = unitsquare.pointToScreenCoordinates( 0, unitsquare.y0 );
drawline( 1, yaxis0.x, yaxis0.y, yaxis1.x, yaxis1.y );
xaxis1 = unitsquare.pointToScreenCoordinates( unitsquare.x1, 0 );
xaxis0 = unitsquare.pointToScreenCoordinates( unitsquare.x0, 0 );
drawline( 1, xaxis0.x, xaxis0.y, xaxis1.x, xaxis1.y );
yaxis1 = unitsquare.pointToScreenCoordinates( 1, unitsquare.y1 );
yaxis0 = unitsquare.pointToScreenCoordinates( 1, unitsquare.y0 );
//drawline( 1, yaxis0.x, yaxis0.y, yaxis1.x, yaxis1.y );
yaxis1 = unitsquare.pointToScreenCoordinates( -1, unitsquare.y1 );
yaxis0 = unitsquare.pointToScreenCoordinates( -1, unitsquare.y0 );
//drawline( 1, yaxis0.x, yaxis0.y, yaxis1.x, yaxis1.y );
</script>
</body>
</html>
