American Dream: How Many Jobs Are Really Available and At What Wage? You Will Be Surprised! [251*6]
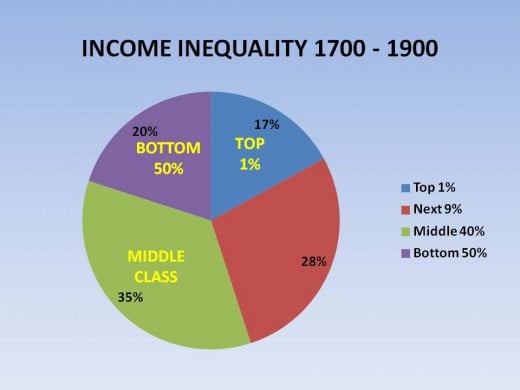
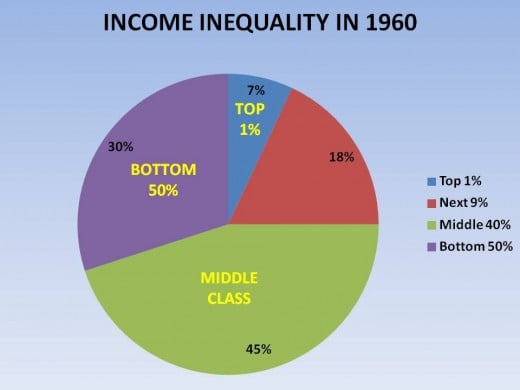
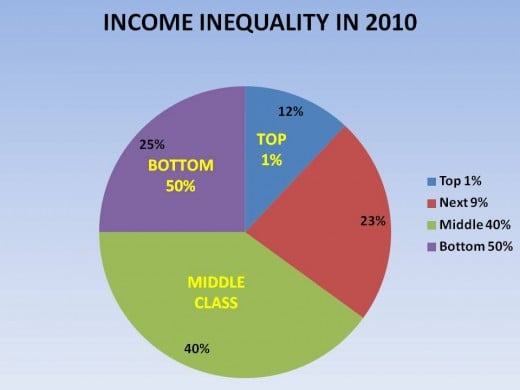
INCOME INEQUALITY IN AMERICA OVER TIME
Click thumbnail to view full-size


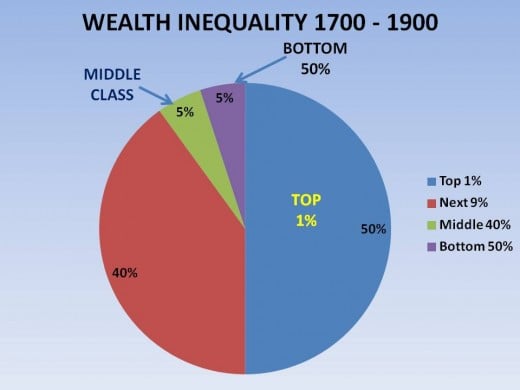
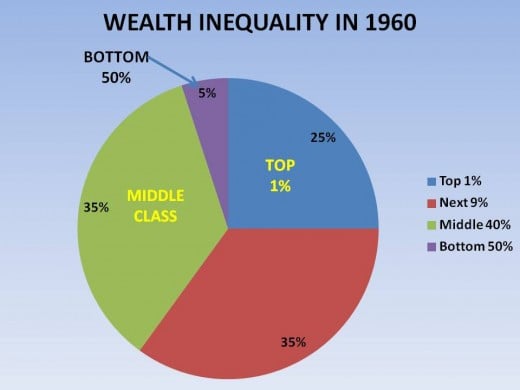
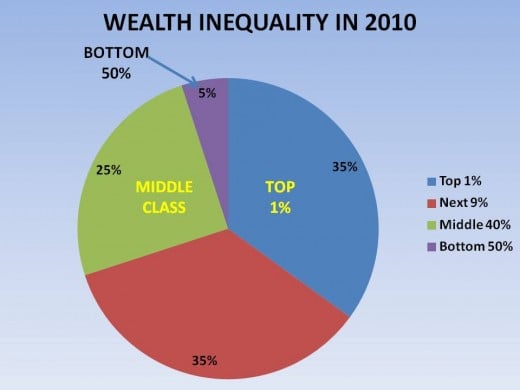
WEALTH INEQUALITY OVER TIME
Click thumbnail to view full-size


QUESTION
WHY IS INEQUALITY DRIFTING BACK TO THE "BAD OLD DAYS"?
Counting Jobs
THE STANDARD REFRAIN FROM THOSE WHO have no sympathy for those who work a 40-hour work week but nevertheless are not paid enough to live anything but a substandard life is that "all they have to do is get a better, higher paying job". Bing, Bang, Boom, the problem is solved as simple as that. Next problem? And this hub is finished ... IF it were true. Of course, since I am writing this, you know it is not, or at least I don't think it is.
To put "substandard life" I will use the results from another hub I wrote on what it takes to survive. Included in this hub is a survey asking what hubbers think is the "minimum it takes to barely survive for a family of three in Omaha, NE". The answer currently ranges from an annual wage of $32,000 to $37,000; this breaks down to $15 - $18/hr. Just to keep confusion to a minimum, my family of three is a single mom with two kids. I will refer back to this as we go along.
The purpose of this Hub is to conflate the perception and reality surrounding a "living wage", or the lack of one, the relative scarcity of job opportunity, and the simplistic solutions offered by the political Right. The point is that the assumptions behind the belief that "just go get a job" is the solution to the "welfare" problem and the resulting "nanny state" are simply false. Instead, they are a fantasy conjured up to justify an off-stated belief that most Americans on the Left are a bunch of lazy, welfare-state dependent albatrosses with no desire to improve themselves who are hanging on the neck of a vibrant America.
My approach will be to take data from the Bureau of Labor Statistics' (BLS) Current Employment Statistics (CES) and Current Population Statistics (CPS) surveys. The CES surveys employers about the job situation and the CPS surveys households about the same thing (among many other things). Since the bottom line is to look at why everybody doesn't have a job, (the ease of getting one is what is implied in the "just get a job" mentality), the data is processed to determine what jobs require what education (or equivalent) levels and the educational achievements of the labor force and "not in labor force" populations. Then it is simply a matter of adding the numbers up and see what that tells us.
Where Are The Jobs?
THE CES TELLS YOU HOW MANY JOBS are available, in what labor categories, and at what wages. The table below summarizes the CES data that will be used.
TOP-LEVEL DISTRIBUTION OF JOBS
MAJOR OCCUPATION
| DESCRIPTION
| # OF JOBS AVAILABLE
| % OF JOBS AVAILABLE
| MEDIAN HR WAGE
| MEAN HR WAGE
| MEAN ANNUAL WAGE
| BARRIER TO ENTRY
|
|---|---|---|---|---|---|---|---|
ALL
| 132,588,810
| 100
| $16.87
| $22.33
| $46,440
| ||
11-0000
| Management Occupations
| 6,542,950
| 4.9
| $45.96
| $53.15
| $110,550
| HIGH
|
13-0000
| Bus & Financial Operations Occ
| 6,658,090
| 5.0
| $30.67
| $34.14
| $71,020
| HIGH
|
15-0000
| Computer & Math Occupations
| 3,696,180
| 2.8
| $37.43
| $39.43
| $82,010
| HIGH
|
17-0000
| Achitect & Eningeer Occ
| 2,380,840
| 1.8
| $35.51
| $38.51
| $80,100
| HIGH
|
19-0000
| Life, Physical, Social Science
| 1,135,030
| 0.8
| $29.26
| $33.37
| $69,400
| HIGH
|
21-0000
| Community & Social Service Occ
| 1,901,730
| 1.4
| $19.62
| $21.50*
| $44,710*
| LOW
|
23-0000
| Legal Occupations
| 1,041,700
| 0.8
| $36.59
| $47.89
| $99,620
| HIGH
|
25-0000
| Education, Training, & Library
| 8,400,640
| 6.3
| $22.19
| $24.76
| $51,500
| LOW
|
27-0000
| Media Occupations
| 1,758,310
| 1.3
| $21.45
| $26.72
| $55,580
| MEDIUM
|
29-0000
| Healthcare Prac & Tech Occ
| 7,755,810
| 5.8
| $29.38
| $35.93
| $74,740
| HIGH
|
31-0000
| Healthcare Support Occupations
| 3,924,390
| 3.0
| $12.54**
| $13.61** ($10.60-$26.56
| $28,300**
| LOW
|
33-0000
| Protective Services Occupations
| 3,257,690
| 2.5
| $17.68
| $20.92*
| $43,510*
| MEDIUM
|
35-0000
| Food Prep & Serving Related
| 11,914,590
| 9.0
| $9.15**
| $10.38** ($9.07-$15.38;$22.42-Head Chef)
| $21,580**
| LOW
|
37-1000
| Bldg & Grounds Cleaning/Maint
| 4,291,410
| 3.2
| $11.04**
| $12.51**($10.64-$18.45)
| $26,010**
| LOW
|
39-0000
| Personal Care & Service Occ
| 3,986,740
| 3.0
| $10.10**
| $11.88**($9.09-$23.75)
| $24,710**
| LOW
|
41-0000
| Sales & Related Occupations
| 14,068,190
| 10.6
| $12.10**
| $18.37*
| $38,200*
| LOW
|
43-0000
| Office & Admin Occupations
| 21,442,800
| 16.2
| $15.39*
| $16.78* ($10.52-$25.81)
| $34,900*
| LOW
|
45-0000
| Farm, Fish, & Forestry Occ
| 435,250
| 0.3
| $9.32**
| $11.70**
| $24,330**
| MEDIUM
|
47-0000
| Construction & Extraction Occ
| 5,088,030
| 3.8
| $19.55*
| $21.94* ($13.42-$36.42;elevator repair)
| $45,630*
| MEDIUM
|
49-0000
| . Installation, Maint & Repair Occ
| 5,138,130
| 3.9
| $19.92*
| $21.35*
| $44,420*
| MEDIUM
|
51-0000
| Production Occupations
| 8,765,180
| 6.6
| $15.03**
| $16.79*
| $34,930*
| MEDIUM
|
53-0000
| Transportation & Material Move
| 9,005,120
| 6.8
| $13.99**
| $16.28* ($10.26-$28.42;Rail Trans workers)
| $33,860
| MEDIUM
|
* - BELOW NATIONAL AVERAGE
** - WAGES LEADING TO SUBSTANDARD LIVING CONDITIONS
TABLE 1
All The Well Paying Jobs Are Out of Reach to the Average American
USING THE CES, JOBS IN AMERICA CAN BE SPLIT INTO THREE distinct groups: 1) those that have a low entrance barrier, 2) those that have a medium entrance barrier, and 3) those that have a high entrance barrier. This is no different to companies trying to enter the market; in some industries it is very easy to start a successful business and in others it is extremely difficult.
Those jobs that have a low barrier are those that require no training and no high school degree; just a willingness to work and learn; fast-food workers who don't handle money or janitors are examples. They also include those that require a high school degree, minor vocational training, and/or a minimum level of previous training.
Medium barriers to employment are those which require a high school degree or some college, both with a few years of previous experience or vocational training. Examples here might be Healthcare Support Occupations, Truck Drivers, Production Operations, low-level managers and supervisors.
Finally, those jobs with high barriers to entry are ones that require a college or graduate degree, years of experience and training, difficult specialized education/training and the like. Here we have senior managers/executives, computer engineers, lawyers and their assistants, and Business/Financial Occupations.
As you will see, the barriers to entry in the job market correlates very nicely with the level of wages as well as the number of jobs available. Indeed, Low (52%) and Medium (18%) level barriers to job entry account for 70% of all available jobs. Further the top mean hourly wage for jobs with medium barriers to entry is $21.94/hour (Construction); for the the low-barrier jobs - $18.37/hour (sales and related). It should be noted that the mean salary for all Major Occupational Categories with low and medium barriers to entry all have average salaries that is less than the average for the entire population of $46,440/yr.
What is left are the high-barrier jobs (30%); they have a mean wage range of $22.23/hour (Education, Training, and Library) to $53.15/hour (Management Occupations).
Exactly Where Can Low Paid Worker Go?
NOT VERY FAR, APPARENTLY! IF LOW-BARRIER workers gain the experience, training, and/or experience to move to medium-barrier jobs, what real progress have they made.
2014 JOB OPENINGS
MAJOR OCCUPATION
| DESCRIPTION
| # OF JOB OPENINGS IN 2014 (000)
| % OF TOTAL OPENINGS
| CUM % BY BAND
|
|---|---|---|---|---|
ALL
| 4,381
| 100%
| ||
31-0000
| Healthcare Support Occupation (Low)
| 294
| 6.8%
| 6.8%
|
35-0000
| Food Prep & Serving Occ (Low)
| 632
| 14.4%
| 21.2%
|
41-0000
| Sales & Related Occ (Low)
| 513
| 11.7%
| 32.9% (LOW)
|
53-0000
| Transportation & Material Moving (Low)
| 836
| 19.1%
| 19.1%
|
21-0000
| Community & Social Services (Medium)
| 296
| 6.7%
| 25.8%
|
47-0000
| Construction & Extraction Occ (Medium)
| 115
| 2.6%
| 28.4%
|
51-0000
| Production Occupations (Medium)
| 297
| 6.7%
| 35.1% (MEDIUM)
|
13-0000
| Business & Financial Occ (High)
| 879
| 20.1%
| 20.1%
|
25-0000
| Education, Training, Library Occ (High)
| 150
| 3.4%
| 23.5%
|
27-0000
| Entertainment Occupations (High)
| 73
| 1.7%
| 25.2%
|
29-0000
| Healthcare Pract & Tech Occ (High)
| 296
| 6.8%
| 32.0% (HIGH)
|
TABLE 2
OK, I Needed Two Tables
AND THEN I CAN PRESENT THE RESULTS, in a few other tables. But first, let's start with this. Current "official" unemployment dropped to 5.9%, At the moment the CBO considers 5.5% to be "full employment", meaning there are that percent of the "Civilian Labor Force" is "actively" looking for work; this only 0.4% less than the current UE rate. These are people who have been 1) laid off, 2) quit, 3) just reentered the labor force plus a few other reasons.
The CBO and most other economists believe rates that go very much above or below the "natural" rate, as Adam Smith might put it, is bad for the economy driving down productivity if it stays above full employment and wage inflation if it stays below for very long; that's the theory anyway. The theory often breaks down when the economy is under stress, like in a substantial recession or when business is allowed to artificially control the labor market, like they did in the 1800s.
To put all of this in perspective, I need to add a little more background, and that is economic growth. Prior to the Industrial Revolution in England, economic growth was near 0% each year. Since the 19th Century until the end of WW II, growth has averaged around 1 to 1.5% per year. Then, after the devastation of WW I, the 1929 Great Depression, and WW II had left the world's economy in a shambles, growth took off and in the end averaged 3.7% in the U.S. by 1980 (although there were a couple of spurts approaching 6% in Europe) when recovery from the destruction was at an end. Since 2009q3, President Obama has achieved a growth rate of 2.2%. Finally, Thomas Piketty recently came out in his book Capitalism in the 21st Century leads the reader through a very good analysis which concludes that economic growth is returning to maybe a 1.5% to 2% annual growth rate. The point, of course, that I am trying to make is that the growth which President Obama has achieved, especially given the unique political headwinds he faced in trying to implement his recovery plan. In other words, 2.2% in nearer to a normal growth rate than 3.5% is. If I am correct with this analysis, then it would be reasonable to assume there shouldn't be much new expansion in the economy beyond normal growth.
So, where does that leave us at the moment? It would be an economy that is growing at roughly a normal rate and an unemployment rate that is near the "full employment" level.
So, if the labor force is near full employment now, then the 9 million +/- (ages 16+, it is around 6 million for those aged 25+) who are currently "officially unemployed" (then there are a couple of million more who gave up looking in frustration) have few places to go other than the roughly 4 million vacancies that will be consistently open; assuming skills and location can be matched. That last phrase, of course is key!
Education DOES Make a Difference
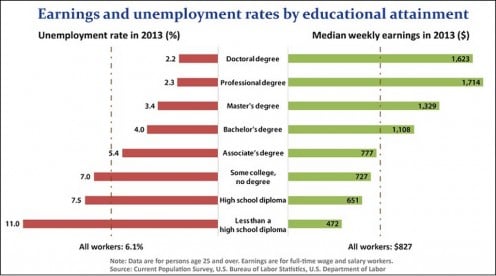
In looking at Table 2, you might notice that 1) only 68% of available jobs are in the Low and Medium categories and 2) almost 32% require advanced education and experience. Consider next that for those same Major Occupation Groups the jobs available are 70%, for the Low and Medium barrier set, and 30% for the High barrier set. Given that 2% represents 88,000 and 2,652,000, respectively, we are looking at a not insignificant mismatch between what jobs are available and those that are needed and that fewer jobs are needed where there are the most unemployed, the poor.
Next, consider this - From Table 1, there are 24.6 million high-barrier jobs available based on the Major Occupational Groups in Table 2. And, Table 2 shows there are 1.4 million job openings in late 2014. Finally, from http://www.bls.gov/cps/minwage2013.pdf we see there are 13.9 million1 (in Dec 2013) with Bachelor degrees or higher that were employed, but not self-employed. Further, 0.3 million were in jobs which paid the minimum wage or less. That would imply there are substantially more in jobs (maybe as much as 6 million, using the Pareto distribution as a very rough estimator) that qualify for low to medium entry-barrier type jobs.
Obviously, that represents roughly 6 million jobs not available for Joe Sixpack. Now let me try to represent what I just said in Table 3.
1. There is an obvious disconnect between 1) the 24.6 million high entry-barrier jobs available, 2) the 13.9 million 2013 estimate of people with Bachelor degrees or higher, and 3) the 1.4 million job opening. Keep in mind that high entry-barrier doesn't necessarily mean "needing a degree"; it could also mean needing advanced votec or other highly specialized training as well. Also, some of the jobs in the high barrier Occupational Groups are support jobs not otherwise categorized elsewhere that might not be high-barrier.
AVAILABLE (000)
| JOB OPENINGS (000)
| OPEN/AVAIL (%)
| UNEMPLOYED BY EDUCATION (25+ years)
| |
|---|---|---|---|---|
TOTAL
| 132,589
| 4,381
| 3.3%
| |
LOW-ENTRY BARRIER JOBS
| 69,931 (52.7%)
| 1,439 (32.8%)
| 2.1%
| 1,371*
|
MEDIUM-ENTRY BARRIER JOBS
| 33,447 (25.2%)
| 1,544 (35.2%)
| 4.6%
| 1,549**
|
HIGH-ENTRY BARRIER JOBS
| 29,211 (22.1%)
| 1,398 (31.9%)
| 4.8%
| 1,805
|
* Combination of persons 25 years and up with no High School Degree plus 25% (arbitrary) of those with High School degrees
** 75% (arbitrary) of those with High School degrees 25 years and up
TABLE 3
CES vs CPS
MY DATA COMES PRINCIPALLY FROM TWO sources, the BLS's Current Employment Survey (CES) and Current Population Survey (CPS); it would have really made my life much easier, and this hub published much sooner, if these two surveys used a common set of rules. But, as you can guess, they don't.
What I am attempting to do is, for the same time period, to count the number of jobs people hold (from the CES) and match them up with the number of employed people (from the CPS). Then, because various jobs require different skill sets, stratify those jobs from the CES into Low, Medium, and High entry-barrier jobs. For example, a kid straight out of high school can't expect to walk into a high paying CEO job; many more years of schooling and experience are needed first.
Then, from the CPS, I stratify the employed people by their education attainment. With this, I start filling the jobs with the people who are employed beginning with matching up college graduates with High-barrier jobs first. Any college grads left over, and there are some, then start filling up the ranks of Medium-barrier jobs and so on. What I am hoping to show with numbers is what I intuitively know to be true, that, as a rule, people at the low end of the educational attainment strata are out of luck in finding jobs. And, given there are about eight million more people looking for work than there are jobs that are unfilled, that creates a major problem for both simply finding work and mobility.
Unfortunately, on my first crack at it, I ended up (using 2012 data) with about 8 million more people than I had jobs ... bummer. So, this is where the differences between the CES and CPS come in and what makes cost and economic analysis fun.
Turns out, the difference is how 1) agricultural workers, 2) multiple job holders, 3) unpaid family workers, and 4) the self-employed are counted ... or aren't. The Current Employer Survey ignores all but the multiple job holders, which it counts once for each job; the CPS only counts a single person. The Current Population Survey, on the other hand, does count the other categories. Based on Tables 15 and 36 of Labor Force Statistics from the Current Population Survey, the net result is about 8.4 million more jobs (or 8.4 million fewer people) available. I took the "fewer people" route in matching up jobs because that is the way employment is reported, especially advertised jobs.
So, what we have with Table 4 below is a hypothetical accounting of jobs available in 2012 and the people who filled them sorted by education/experience requirement and attainment. As mentioned earlier, jobs were filled from the top down using those with college degrees first until all of the High-entry barrier jobs were taken. Any remaining would then start filling the Medium-entry barrier jobs until they are exhausted. Then those with some college would come next, and so forth until all of the people and all of the jobs were accounted for. I had a few hundred thousand left over, but out of 132 million, whose counting.
HYPOTHETICALLY - WHO FILLS WHAT JOBS?
CES - JOBS
| CPS - EMPLOYEES
| |
|---|---|---|
High Barrier - College or Lot's of Experience
| 37,875,690
| 37,875,690
|
Medium Barrier - College or Lot's of Experience
| 34,008,680
| 7,603,310
|
Medium Barrier - Vocational &/or Some Experience plus HS
| 26,405,370
| |
Low Barrier - Medium Barrier - Vocational &/or Some Experience plus HS
| 60,704,530
| 12,597,680
|
Low Barrier - HS Degree or Less, Little Experience
| 48,106,850
| |
----
| ----
| ----
|
Excess Multiple Jobs
| 3,472,500
| |
Farm, Self-Employed, & Non-Paid Family Members
| 11,744,000
|
CES - JOBS are from surveys of employers while CPS - EMPLOYEES are from surveys of households from the same time period. - TABLE 4
THE FIRST THING TO OBSERVE FROM TABLE 5 is that there are more job openings for jobs requiring a college degree or equivalent experience than there where "officially" unemployed" people looking for work. By the way, these aren't made up numbers but very likely the way it really was near the end of 2012. So, given this situation, what might happen? I would think that college grads already employed would move up and take at least some the newly available High-entry barrier jobs. And, that is what I going to do, take what I need (119,000 college grads) from Middle-entry barrier jobs and promote them. That means I can promote 119,000 people with vocational and/or some experience plus a high school degree from Low-entry jobs to Middle-entry. Finally, in theory, 119,000 more Low-level entry job openings will be made available.. (I hope that made since, but Table 6 is the result.)
Notice what happens in our hypothetical scenario, All of the college graduate unemployed have found jobs and, still working high to low, 2,634,000 of the middle-level educated unemployed also find jobs. Guess who gets left out in the cold? All 7,313,000 unemployed with high school degrees or less!
A THEORETICAL DISTRIBUTION OF UNEMPLOYED INTO JOB OPENINGS
2012
| UNEMPLOYED (by education)
| OPENINGS (by barrier)
|
|---|---|---|
COLLEGE DEGREE
| 2,131,000
| 2,250,000 (H)
|
SOME COLLEGE
| 3,860,000
| 1,384,000 (M)
|
HIGH SCHOOL DEGREE or NO DEGREE
| 7,313,000
| 1,250,000 (L)
|
TABLE 5
UNEMPLOYED (by education)
| OPENINGS (by barrier)
| ||
|---|---|---|---|
COLLEGE DEGREE
| 2,131,000
| 2,131,000
| The other 119,000 openings were filled by already employed college grads.
|
SOME COLLEGE
| 3,860,000
| 1,384,000
| The 119K opens created with the promotion of the college grads was filled from below
|
HIGH SCHOOL DEGREE or NO DEGREE
| 7,313,000
| 1,369,000
| This left an additional 119K openings for the Low-entry positions.
|
TABLE 6
Table 35 is offered mostly for your information, it is not easy to find. I provide it because there is much controversy over what constitutes the "missing" unemployment ... those not working who aren't counted in the "official" unemployment numbers.
At the end of 2012, the "official" unemployment rate was 7.9%. No one as come up with an alternative way of doing the calculation, they just say the "Real" rate is this or that, but always much larger. Well, from the last column in Table 7, you can see, the "Real" rate can very from the "official" rate of 7.9% to a high of 12.3% in 2012 when you include people who say they want a job even though it has been more than a year since they looked (which, when coming out of a Great Recession with a headwind against recovery probably isn't an unreasonable thing to consider.) The rate I personally would like to see included is the Discouraged Worker for Job Reasons, 0.6% in this case.
But, as I have said in other hubs on the subject of unemployment rates, it doesn't really matter, from an analytical point of view, which rate you use so long as it is reasonable and you use it over a long period of time (meaning decades).
TABLE 35. - Characteristics of Those Not In The Labor Force
2012 (000)
| 15 - 24
| 25 - 55
| 55 +
| TOTAL
| TOTAL LABOR FORCE
|
|---|---|---|---|---|---|
Total Not In Labor Force (Remainder are either Employed or "Officially" Unemployed)
| 17,499
| 23,061
| 47,750
| 88,310
| 142,469
|
- Do NOT want a Job Now
| 15,383 (87.9%)
| 20,248 (87.8%)
| 46,120 (96.6%)
| 81,752 (92.6%)
| |
- Want a Job
| 2,115
| 2,813
| 1,630
| 6,558
| 4.4%
|
-- Looked, but not in more than a year
| 1,064 (50.3%)
| 1,328 (47.2%)
| 998 (61.2%)
| 3,390 (51.7%)
| |
-- Looked, but not in more than 4 weeksL
| 1,052
| 1,484
| 632
| 3,168
| 2.2%
|
--- Not available for work now, but could be
| 282 (26.5%)
| 288 (10.2%)
| 82 (13%)
| 651 (20.5%)
| |
--- Marginally Attached (available for work)
| 770
| 1,196
| 550
| 2,516
| 1.7%
|
---- Discouraged over job prospects
| 217 (32.1%)
| 451 (37.8%)
| 241 (44.9%)
| 909 (36.1%)
| 0.6%
|
---- Not looking for other reasons
| 553
| 746
| 309
| 1,608
| 0.7%
|
----- Family Responsibilities
| 33
| 147
| 49
| 229
| |
----- School, Training, Health, Other
| 520
| 598
| 260
| 1,178
|
TABLE - 7: Percentages are of the preceding total. * Percentages in this column are the Additional unemployed IF included in the "Official" Unemployment Rate
WAGES - The Median Wage (50% of Americans make more than and 50% make less than) is $16.87/hour (2013) or $35,090/year. According to a poll I have running in Hubpages, 34 Hubbers, so far, think a "subsistence" level income for a family of three in a medium-cost area is between $31,600/yr and $37,416/yr (you can enter your thoughts here, if you want). On the other hand, the Mean Wage is $22.33! The large difference between the mean and the median tells me there is a substantial wage divergence with the skew going toward the high-earners.
JOB AVAILABILITY - 2014 does not look too terribly different than 2012, although there is no question the job market is better despite all of those Part-Time jobs by necessity. And in 2012, using my model as a guide, there were roughly 4.9 million job opening and between 13.3 million (official) and 19.9 million people who want jobs, depending on how you count them. One can assume that the better educated and most experienced will fill most of the available jobs leaving little for those on the lower income rungs, the ones the Left wants to help, out in the cold. It is these people the Conservatives are tell to go find a job when there clearly are none; they are asking for the impossible and don't blink an eye.
Here is What is Really Wrong With the Conservatives Panacea of the World's Problems - Just Get A Job.
WE NOW HAVE ALL OF THE PIECES TO UNDERSTAND WHAT IS GOING ON in the Employment/Job world. The scenario I created is admittedly simple and I acknowledge the real world is much more complex than what I have described up to this point. But, in theory, it actually could work this way, but the chance of the sun blinking out tomorrow has more of a chance of happening than this does. Nevertheless, its simplicity doesn't reduce its instructive or modeling usefulness in showing why the Conservative mantra is nothing but hot air.
The Conservative's oft stated solution to the Left's desire to have central government support programs for the jobless or underemployed is simply have the unemployed go 1) get a job and/or 2) go get trained and ask your boss or a new employer for a promotion; done right, he/she will give it to you of course. As we have seen, this is pure, unadulterated Hogwash! Conservatives should always be called out for this simpleton solution. It won't take a lot of analysis like this. Just ask them how they propose to fill 4 million jobs with 7 million people (and those are just the ones currently looking)? If they don't have an answer, and they won't, suggest they don't have a clue, then, as to what they are talking about.
Through the above tables and analysis, I wanted to make three points, 1) wages in this country are exceeding low, so low that it keeps nearly 1/2 of all Americans are within spitting distance of being at a subsistence level of living, at least by American Dream standards; compared to the slums of Bangkok, of course, America's poorest are still living like surfs, at least; 2) that America is nowhere near the point where "go out and get a job" or "simply switch jobs if you don't like the one you have" has any validity or meaning (other than as material for a joke) at all; and 3) practical job mobility (which I will get to) is a pipe-dream for those without a college degree, lots of vocational training, or a lot of experience.
Let me briefly mention Job Mobility. It should be reasonably obvious from the discussion on job availability, that job mobility must be in direct proportion with job availability. We saw in our scenario in the last section that the very mobile were college grads; they easily moved into job openings at higher levels as they became open. The same happened with the next group down, but less so as a percentage of the entire group. There was very little, if any mobility for those with High School degrees only or worse, no degree at all. And there is never going to be until the unemployed with more education and experience find jobs. In our example, the unemployed ranks of that group would have to fall from the 3.86 million they are at in 2012 to about 2.7 million. Only then will there begin to be noticeable mobility in the bottom educational rung. Have we made it there in 2014? I don't know, I don't have the data yet to tell, but it sure would be nice.
Further, I couldn't find data on the educational achievement distribution of the Marginally Unemployed and Not in Labor Force. Consequently, I have no idea what is lurking out there in the more educated cohort who stopped looking for work that will jump back into looking for work. The effect of that, of course, is to keep the less educated out of the job market for an even longer period of time.
QUESTION # 1: SO, What Do You Think?
Are You Satisfied That There Have Not Been Enough Jobs Available For Everybody Who Wants One, To Get One?
QUESTION # 2
GIVEN Your Answer to Question ! is YES, Do You Think the Federal and State Governments Should Help Those Who Can't Find Work?
DEMOGRAPHIC SURVEY # 1
Do You Tend To Lean Politically More To The ...
DEMOGRAPHIC SURVEY # 2
Are You ...
RELATED LINKS
- Fifteen Things You Probably Don’t Know About the Ultra-Wealthy
15 ways in which the wealthy-elite undermine democracy
AMAZON ON JOB
© 2014 Scott Belford

