Employee Satisfaction and Absenteeism
Employee Satisfaction & Absenteeism : A Correlational Study Design
Christian L. Perry
Argosy University
Industrial and Organizational Psychology
To establish correlation between employee satisfaction and absenteeism the values of each variable must be measured for comparison. To accomplish this, a correlational design would be used to compare the two variables and their influence over one another (Riggio, E. R., 2008). To retrieve this data the Minnesota Satisfaction Questionnaire (MSQ), consisting of 20 questions regarding various aspects of their work environment with regards to their feelings of work stability and individual value (Zeffane, R., Ibrahim, M. E., & Mehairi, R. A., 2008). These are measured using a rating scale inclusive of, 5=Extremely Satisfied, 4=Very Satisfied, 3=Satisfied, 2=Somewhat Satisfied and 1=Not Satisfied.
Influential to the employee’s feelings of security and stability is consistency in hours available and their pay received. For hourly employees this can vary greatly depending on the needs of the business. However, for salaried employees the amount of hours worked and their respective pay does not change. Therefore it would be beneficial to stratify the sample to be inclusive of both hourly and salaried employees with regards to their respective MSQ scores.
There are, however, variables considered to be extraneous in that they are not viable for measurement with regards to the hypothesis yet still can have an influence on the data collected. With regards to administering the MSQ to a selected group of individuals working at a company the extenuating variable would be represented by the possibility of skewed answers on the questionnaire as a result of fearing disclosure and subsequent negative consequences. To combat this, the questionnaire could be administered independently from the work environment such as by mail with an independent return address from the employees company. This may reduce their fear of information disclosure. In addition to this the fear may remain due to the need for individual’s identification for the purposes of correlating the individuals absentee score with their MSQ score. This could be combated by assigning a numerical “tag” to each survey with respect to the employee’s name. For example; Tina is assigned the number 2399-4A. This number printed innocuously on the survey will allow researchers to identify her without the need for her printing her name on the questionnaire.
For the purposes of measuring the employee’s absenteeism archival data from the company would be utilized. However, the variables of willful and non-willful absentee’s must be considered as well. Although it may be very difficult to determine what is willful and what is not the exclusion of medically documented absentee’s will grant a more accurate representation of the psychological correlation between employee satisfaction and absenteeism. Although there are situations in which an employee may be absent due to illness yet does not receive medical care it would be extremely difficult substantiate.
For descriptive purposes we will use a hypothetical company named Conquest. Of the 1000 employees 42% are female and 58% are male. Of these employees 72% are considered hourly and 28% are considered salaried employees. A sample size of 200 randomly selected employees consisting of 144 hourly employees inclusive of 60 females and 84 males. Respectively the salaried sample would consist of 56 salaried employees inclusive of 24 females and 32 males. Each individual would have their absentee score calculated and assigned a designation matching the employee name. This would then be attached to each individual MSQ’s that would subsequently be mailed to the individual’s respective homes. The individuals would be provided return postage to a neutral collection party for analysis of scores. These scores would then be compared to the individual’s absentee score to establish the correlation coefficient.
The correlation coefficient is established by the use of deviations scores. To acquire the deviation scores the mean score of all results for each variable would be subtracted from each individuals respective raw score for that variable as presented by their MSQ and absentee raw scores. This would be represented as and. From this the product of deviation scores would be calculated using the formula (. We then would add all the products of the deviation scores and square the deviation score for each variable represented by the formula and. We would then add up all the deviation scores for each respective variable, multiply them and take the square root of the result. This will give us a correctional number to be used to help account for variance. We would then divide the sum of products of deviation scores by the correctional number. This will give a result between +1 and -1 establishing either a positive correlation or a negative correlation (Aron A., Aron N. E. & Coups J. E., 2009).
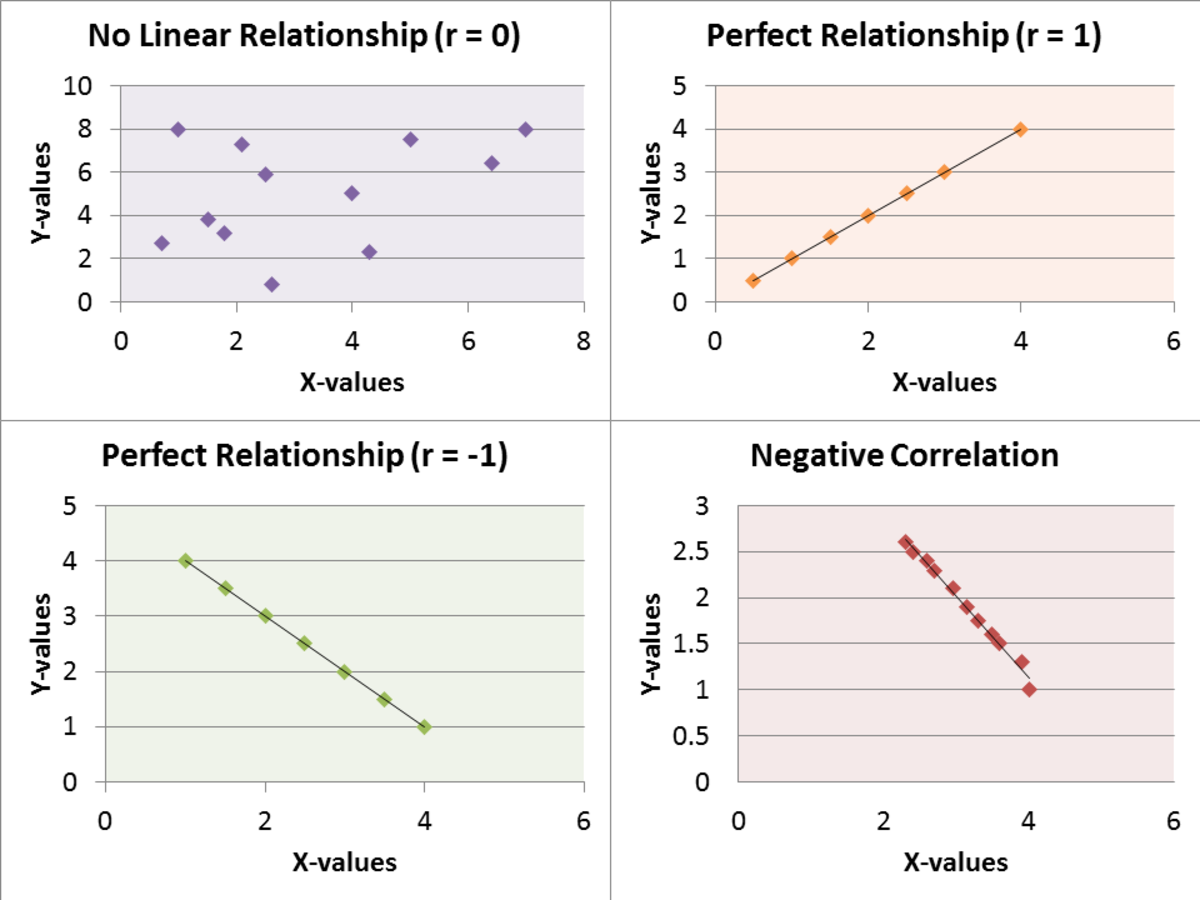
Suppose the resulting value of r = -.70. This would establish a negative correlation in that the elevation of the independent variable is correlated with a decrease in the dependent variable. In addition to this we can use the deviation from zero to establish the relative strength of the correlation. In this instance the result is closer to -1 than 0 establishing a strong negative correlation. For the purposes of employee satisfaction correlating with absenteeism this result shows that increased employee satisfaction can be correlated with low absenteeism and low employee satisfaction can be correlated with high employee absenteeism.
By the use of a random sample correlational design and factoring of the correlation coefficient we are able to establish negative, positive or no correlation between variables. This can be very useful in examining work related relationships between variables and subsequent initiatives towards improvement.
References
Aron A., Aron N. E. & Coups J. E., (2009). The Correlation Coefficient, Correlation, Chapter 11, Statistics for Psychology, Pearson Education Inc. p.443
Riggio, E. R, (2008). Research Methods in Industrial/Organizational Psychology, Chapter 2, Introduction to Industrial/Organizational Psychology, Pearson Education Inc. p. 30
Zeffane, R., Ibrahim, M. E., & Mehairi, R. A. (2008). Exploring the differential impact of job satisfaction on employee attendance and conduct. Employee Relations, 30(3), 237-250. doi:http://dx.doi.org/10.1108/01425450810866514


