How We Increased Profits by 30% Simply Looking One Level Deeper into our Key Performance Indicators

What if you could maximize lead monetization exponentially simply looking one level deeper into your KPI's?
If someone wanted to get healthy and lose weight, they could simply watch and manage how many calories they ate and how many calories that they burned. If you burn 500 more calories than you eat every day for a week, you should lose about 1 – 2 pounds. However, if someone wanted to get into phenomenal shape like an elite Olympic athlete you would not only measure calories in and calories out.
Why? Because the way your body breaks down carbohydrates protein, fats and the effect they have on your body differ vastly.
If your calorie goal each day is 1,200, and you ate 1,200 calories of ice cream, donuts and pizza you would meet your goal of calories. However, you would be consuming lots of sugars, fats and carbohydrates with this type of plan you may lose weight, but you would most likely be tired, hungry and moody because you would not be meeting your nutritional needs. You would not be able to maintain this program long term and eventually burn out.
To be truly fit like an elite athlete you not only measure your calories, you measure fats, proteins, carbs, how much you sleep, you get massages, acupuncture, dry needling and anything else that will allow you to perform at your highest level.
As a business owner, your main goal is to make profit, so if you measured revenue in versus revenue out and you are making a profit, then just like calories in and calories out, you are hitting your goal.
However, if you want to be a highly successful business that maximizes profits, just like an elite athlete, you must measure multiple aspects of your business. Not one level deep but multiple levels.
Every business has key performance indicators which are quantifiable measurable value that demonstrates how effectively a company is achieving key business objectives.
Now most business are measuring more than just profits; however, I have seen businesses make decisions that cost them revenue by measuring the wrong numbers or not going deep enough into the numbers.
For example, I worked for a company that sold books on TV about how to make money in real estate. I was originally just in sales management, but them got promoted to chief operating officer.
The business would sell the book on TV and then contact those book buyers to upsell them on personal coaching, seminars, and other services.
Their key performance indicators at the time were Cost Per Acquisition (CPA) and Dollar Per Lead (DPL). Cost Per Acquisition was how much was spent on TV to generate a book buyer. Dollar Per Lead, was the amount of revenue in upsells per book buyer they generated.
So, for example, if they spent $100,000 on TV and 1,500 people bought the book their CPA would be $66. Then if we did $500,00 in personal coaching sales and other services the DPL would be $337, so each book buyer generated a profit of $267 on average.
Now the company split the telemarketing reps into teams and measured each teams DPL and gave the new or fresh book buyers to teams with the highest DPL’s.
The company was highly profitable, so these are the general numbers they used and by measuring profits they were running a successful company. However, after I dug deeper into the numbers I realized they were not maximizing profits.
You see all book buyers are not created equal.
The company would air the infomercial on many TV stations to generate between 1,200 and 1,800 book buyers per week. I had to start placing media buys and I got to see exactly how much we spent on each station versus how many buyers we got. After looking at the different stations which were for example: CNBC, CNN, Spike, OWN, Fox, TBS, Travel Channel, FX, Oxygen, History Channel, TNT, Fox News, Lifetime and others.
From being in sales with the company for many years within the company I knew our target market for coaching buyers was males between the ages of 35 – 60 years old. Looking at these stations I knew some like Oxygen and Lifetime were not our target. I assumed that people watching CNN, CNBC, and Fox News, would be more likely be our target market to sell coaching then the viewers of Oxygen and Lifetime. However, I wanted to prove out my theory before jumping to conclusions. You MUST NEVER assume anything if you have actual data to measure.
I went to the IT department and I had them take every coaching sale from the previous 12 months and match them to the TV station. We then calculated how many book buyers bought from each station and how much media was bought for each station.
This is just a small snap shot of some of the numbers:
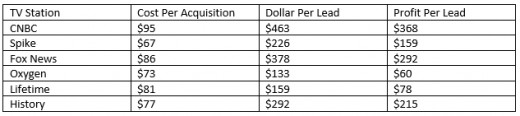
You can see from this snap shot that it was not just a small difference between CNBC versus the Oxygen station. Now it was $22 more to generate a book buyer on CNBC and the company did not like spending more than $100 for a book buyer because they were just using the overall average DPL over all the buyers versus DPL for a specific station. They were assuming since it was the same infomercial people we are watching and that they were buying the book the network would not play a role. In fact, after paying commissions and fulfillment they were losing money on certain stations like Oxygen.
Immediately as a company we stopped buying media on a station that were not profitable and starting spending more of that money on stations like CNBC, Fox News, and the History Channel. This one change increased our profits by about 15%. It also helped sales morale because we were selling a higher percentage of the book buyers we were talking with because we were reaching more of our target market.
Another small change we made was measuring the DPL down to each individual marketer instead of just the team. A teams DPL might be $400, but one marketer could have a $100 DPL while another had a $600 DPL. Obviously, you wanted to put more fresh book buyers into the hands of the people generating the highest DPL.
Now they were tracking six-week sales volume for each marketer and handing out new book buyers based on this number, however that did not have a direct correlation with DPL. Some guys were being favorited by the team leaders, so they got more fresh book buyers which increased their sales volume, but their DPL was lower.
We would also get inbound calls and those people were most likely to buy coaching, so that would inflate numbers for some sales reps. I wanted to create a model where reps had control of their own destiny. What we did was change how fresh book buyers were given out each week. We would look at the rep’s individual sales volume percentage of the overall sales volume and the following week would get that percentage of the fresh book buyers.
For example, if a rep generated $10,000 in sales and the entire sales floor did $300,000 then they generated 3% of the sales volume. If we had 1,500 fresh book buyers they would get 3% or up to 35 fresh book buyers.
Then we also changed so that if an inbound call came in from a book buyer that would get looked up in the system and be given to the rep it was assigned to.
This new model based everything on numbers and no favoritism, which is the only thing the sales reps asked for. Also, because a rep could only get 35 fresh book buyers max per week, the team leaders had to help all their people more.
These change to tracking DPL down to the marketer, giving out fresh buyers based on sales percentage and giving the inbounds back to the marketer increased the DPL by 15%, so between eliminating certain TV Stations and managing book buyers better we increased profits by 30%!
How can you apply this?
Some of you reading this may not be advertising on TV, but maybe you are using Google AdWords or Facebook ads. If you are trying to get someone to opt-in to an email list to market and sell your product or service you may love a keyword because the Cost Per Click is low and the opt-in rate is good, however they may not be buying anything.
You should be looking at every number that is available to you. Obviously, the examples I gave had extreme impacts, but even if you got 1% better in ten areas that is 10%. You should sit down with your team and see if there are any key performance indicators your team is not utilizing that could help increase profits.
?")


")


