Kuwait Stock Market Performance
Kuwait Stock Market
The Kuwait Stock Exchange (KSE) has a long history. Share trading began in 1952 with the establishment of the National Bank of Kuwait, the country’s first shareholding company. Kuwait’s first law concerning share issues came into force in 1962, and in 1970, a new law was implemented to regulate stock trading in shareholding firms. In 1975, more governing regulations were put into practice.
The KSE officially opened in 1977; it was reorganized in 1983 as an independent body. The KSE was closed in 1990 when Iraq invaded Kuwait; it resumed trading in 1992. In 1996, Kuwait implemented an automatic trading system and became the first country in the world to install such a system in Arabic. The new system allows more equitable and efficient securities trading and has improved competitiveness in the market as well as enhanced equality among traders. The KSE is generally buoyant despite some correction earlier. On June 10, 2008, it reached an all-time high of 15,329 points and closed at a record 15,308 points.
Kuwait doesn’t sell itself like some of its neighbors do. There is no flashy marketing campaign – indeed, there aren’t many flashy enterprises in the market. But the country has several long-term ventures on the horizon that are gradually becoming more open to foreign investment and could be very attractive, if you have the patience.
Oil and gas still drive the economy
Like all Gulf countries, the oil and gas sector drives the economy. But Kuwait has particularly large reserves – currently considered to be the fourth largest in the world – containing an estimated 104 billion barrels, about 8.5 percent of the world’s total. Kuwait’s oil production peaked in 2006 at 2.68 million barrels a day, and though not quite that much now, it remains much more than it was six years ago.
Slow but steady advances
Of all the Gulf countries, Kuwait has been particularly slow to privatize and liberalize. It is generally agreed in parliament that these moves are necessary – the public sector currently contributes a whopping 77 percent to the Kuwaiti GDP – but how much and how fast is a hotly contested issue.
With its high levels of liquidity and history of asset management, Kuwait has long been considered a major financial center in the region. Not wanting to lose this status, the parliament passed a law allowing for the presence of foreign banks in Kuwait in 2005. Since that time, BNP Paribas, HSBC, and
Citibank have opened operations and are doing a brisk business in the country. Foreigners are allowed to own up to forty percent of shares in those banks that are listed on the Kuwait Stock Exchange (KSE).
The KSE is the bright spot in the landscape of Kuwaiti investment laws. Currently, only the banking sector is limited in the amount of shares that are available to foreigners (40 percent). There is no limit on any other listed company.
The existing Kuwait Free Trade Zone (KFTZ) – which allows 100 percent foreign ownership, tax exemption, full repatriation of capital and profits, and is very close to the airport.
Foreigners can now invest in KSE
In September 2000, the government issued a law on foreign investments that allowed foreigners to invest in the KSE for the first time. Like other bourses in the Gulf region, the KSE is trying to crack down on potential abuses that might deter foreign investors, The KSE says that it is planning new measures to better protect the rights of small shareholders and that it aims to promote transparency. An independent regulatory authority for the exchange is a key goal.
With 203 listed companies, the KSE is ranked the second most active stock exchange in the region. It lists stocks in 10 categories – banking, investments, insurance, real estate, industry, services, food, non-Kuwaiti businesses, mutual funds, and parallel markets. All regulations for companies listing on the KSE, as well as regulations governing foreigners’ participation in the KSE, are detailed in English on the KSE’s website.
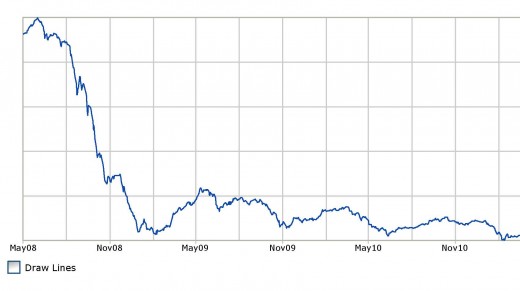
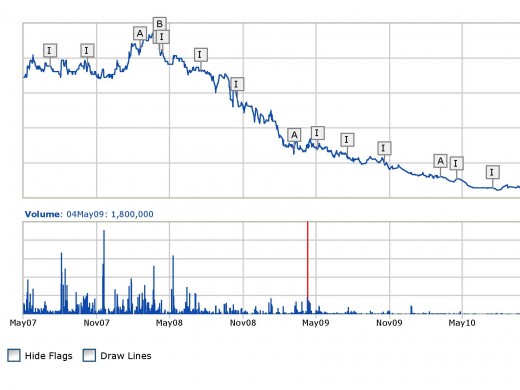
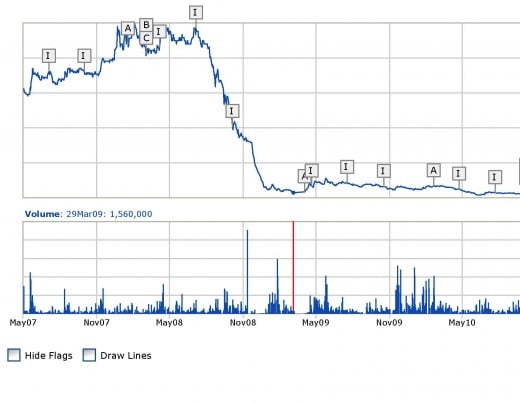
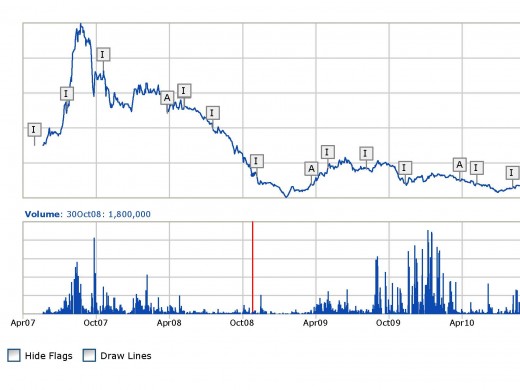
The Collapse and re collapse of the Kuwait Stock Market Index
The 2008 Outlook
Earnings: At the heart of our call is the forecast for earnings. We expect earnings to grow by 42% during 2008.. This earnings growth was in spite of muted earnings performance by Zain (MTC) which posted only 3% growth in earnings. However, other blue chips posted strong earnings like Kuwait Finance House (+46%), National Industries Group (+105%), & Gulf Bank (+32%). Year 2008 is expected to see Zain post a growth of 37%.
P/E: The price to earnings multiple for Kuwait jumped from a modest 11.7 in 2006 to 20 by the end of 2007 thus breaching its long-term sustainable average of 18.3. A reversion to mean will imply a P/E contraction of about 8%, which we believe to happen.
Kuwait Stock Exchange Performance
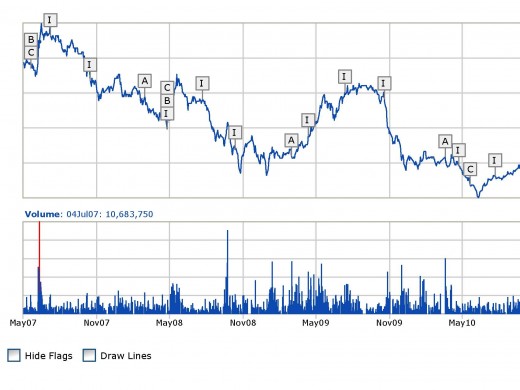
From the lows of Financial Crisis the Kuwait Stock Market is never able to come back. There are many issues needs to be resolved before the market can move up. Toxic in the system created by the financial crisis is still there and needs to be cleaned, the second issue is governance and transparency along with insider trading, cross holding of the companies are killing the stock market.
During 2009, equity markets around the world recuperated from the previous year’s history-making decline that was caused by global financial crisis. Kuwait, along with the rest of the GCC, was also recovering from the stock market losses it suffered in 2008. With the exception of the KSE, GCC markets were able to generate healthy gains in 2009 against year-end 2008 figures. Kuwait Stock Exchange (KSE), measured by its KSE Index, was able to grow 3.8% YTD as of 1H-2009. On the contrary, the index decreased by 13.5% during 2H-2009 to reach 7,005.3 points, resulting in a 10.0% y-o-y decline for 2009. Furthermore, the Global General Index decreased by 9.8% during 2009 to reach 186.2 points.
Among GCC markets, the Saudi Arabian market, as measured by its Tadawul All-Share Index, witnessed the strongest gains in 2009 at 27.5%. The second highest gainer for the same year was Abu Dhabi, as measured by its ADX General Index, which witnessed a 14.8% increase. The market which witnessed the largest losses in 2009 was Bahrain, as measured by its Bahrain Bourse All-Share Index, which declined by 19.2%. However, 2010 was a different story for GCC equity markets. The Qatari market, as measured by its QE Index, witnessed the strongest growth as it increased by 24.8%. On the other hand, markets of Abu Dhabi, Dubai, Bahrain, and Kuwait witnessed losses in 2010, with Dubai witnessing the largest losses as its DFM Index declined by 9.6% y-o-y. Additionally, the KSE Price Index decreased by 0.7% y-o-y in 2010. However, the Global General Index grew by 20.0% during the same period. This is because the Global General Index is market-weighted (unlike the KSE Index which is price-weighted) and the growth during the year was caused by the market heavyweights, like NBK, Zain, and KFH, while the performance of most of the remaining stocks remained dampened.
Market Capitalization
Despite growing by 14.3% during the first 8 months of 2009, the market capitalization of the KSE declined by 9.5% y-o-y at the end of 2009 to reach KWD30.2bn. After decreasing by 17.3% during the first 2 months of 2009, market capitalization increased by 38.1% from end of February to end of August 2009. However, from September to December 2009, the market capitalization declined by a monthly average of 4.6%. The largest m-o-m decrease during the year was in January (13%), while the largest m-o-m increase was in May (11%). Furthermore, the Banking sector had the largest market capitalization by any sector as it accounted for 33% of total KSE market capitalization. Services was the second-largest sector, and combined with the Banking sector, they accounted for 61% of the KSE market capitalization.
In 2010, earnings of KSE listed companies excluding Non Kuwaiti firms, rose a staggering 319.5% to KD 1.6 bn as compared to KD 381.9 mn in 2009, mainly driven by market heavyweight ZAIN’s KD 1.06 bn profit that included a one-time capital gain of KD 741.8 mn from the sale of its African unit. Excluding ZAIN’s one-time profit for 2010, aggregate market earnings would have increased by 125% to KD 860 mn as compared to KD 382 mn recorded in 2009. Net profits of the Banking sector surged 62% to KD 575.4 mn in FY-10 against KD 355.8 mn the previous year, mainly driven by the drop in loan loss provisions (LLP) booked during the year which plunged by 31% to KD 507.7 mn. Although a number of investment companies resorted to rescheduling of its debt obligations, persisting lack of confidence and transparency led the investment sector to continue its lackluster performance in 2010. During the same period, the investment sector incurred losses of KD 138 mn, a significant reduction as compared to massive losses of KD 415.4 mn incurred in 2009 mainly due to a decrease in impairments on investments and provisions.
Devaluation on investment properties and rising impairments weighed down on Real Estate companies, as the Real Estate sector continued to incur losses of KD 95 mn as compared to a loss of KD 98.4 mn in 2009. A rebound from the crisis lifted the Industrial sector to post a second year of profits of KD 78.4 mn, charting a 380% growth in profits over 2009. Meanwhile, ZAIN’s sale of its African unit boosted the Service Sector’s earnings for the year recording profits of KD 1.1 bn as compared to KD 470.5 mn in the previous year. Excluding the extraordinary profit from the deal, the sector’s profits would have declined to KD 364.8 mn due to diminished returns posted by Agility and The Sultan Center. The Food sector witnessed its profits grow 7.5% to KD 52.7 mn, supported by sector heavyweight Americana, while the Insurance sector was the best performer for the year with a 430% growth in profits to KD 22.1 mn.
Capital Market Authority
Capital Market Authority
After many failed attempts, the Kuwaiti Parliament finally passed Law No. 7 of 2010, which established a Capital Markets Authority (CMA) in Kuwait on February 21, 2010. The heavy losses suffered by the local investors during the global financial crisis were the last straw that led all related parties to create a CMA to monitor the stock market. The new CMA, which is under the supervision of the Minister of Trade & Commerce, will be an independent body whose purpose is to protect investors and create transparency in the market. The main objective of the law is to separate the market’s operational activities and regulatory functions from its regulatory and legislative bodies. The CMA is also expected to lure in foreign institutional investors, who have been interested in entering the Kuwaiti market but have been unwilling to do so due to a lack of a governing body to monitor the KSE‟s activities.
Article 6 of the CMA law states that “the management of the CMA shall be run by a board of commissioners which consists of five full-time commissioners who shall be appointed by a decree based on the nomination of the relevant Minister. The decree shall appoint the President and Vice President of the board, as well”. I
The objectives of the CMA are: a) regulating securities‟ business with fairness, competitiveness, and transparency, b) protect the investors, c) reducing patterned risks, d) implementing disclosure to prevent conflict of interest, insider trading, etc... e) Educating the public on investment activities, benefits, risks, etc…and f) ensuring compliance with relevant laws and regulations. Furthermore, the CMA‟s responsibilities are to:
- File civil and commercial legal cases against violators of this law.
- Receive complaints made about violations of this law.
- Conduct procedures which will help uncover crimes stated in this law.
- Inspect and audit authorized persons.
- Purchase, own, and dispose of assets of any nature.
- Print and publish related CMA materials.
- Impose fees and collect fines.
Under the new law, an entity is permitted to establish a stock exchange and a clearing house, pending the approval of the CMA. Furthermore, only shareholding companies may be granted a license to establish a stock exchange and/or a clearing house. All stock exchanges and clearing houses in Kuwait must comply with CMA regulations, and the CMA has the right to cancel either license. By virtue of the law, the Kuwait Stock Exchange and the Kuwait Clearing Company are considered licensed and both have one year, after the executive regulation is issued, to comply with CMA regulations.
The CMA has specifically cited penalties and fines to all crimes committed that violate its regulations. By doing so, it is protecting all investors from crimes such as insider trading, non-disclosure, price manipulation, and other similar activities. The severity of the punishment will be decided by the Capital Markets court, which will be established to handle all capital market cases. An appeals department will also be established to handle all the appeals of the Capital Markets court‟s decisions.
The CMA deals with market-related issues such as regulated activities (brokerage, portfolio management, funds), auditing, mergers & acquisitions, initial public offerings, disclosures, and penalties. We believe the establishment of such a law in Kuwait is a step in the right direction, as it aims to ensure fairness, transparency, and competency in the market.
On March 13th, 2011, the CMA announced that the executive regulation of the law has been published in the Kuwait Gazette, and that the law is effective as of that day. Furthermore, the CMA announced a specific deadline for each related entity to comply with the law‟s regulation: the KSE, clearing houses, and investment companies have been granted one year since publishing the regulation in the official newspaper, while brokerage firms and investment funds have been granted six months. Within one year of publishing the law, the CMA will work on privatizing the Kuwait Stock Exchange in the following process: 50% will be publicly auctioned between listed companies (each stake equaling 5%), and the remaining 50% will be an IPO for locals.
Present Market Performance
Company
| 2009
| 2010
| Change
| |
?National Bank of Kuwait
| 265,219,946
| 301,686,152
| 13.70%
| |
Gulf Bank
| -28,073,000
| 19,059,000
| 167.90%
| |
Commercial Bank of Kuwait
| 152,000
| 40,535,000
| NM
| |
Al Ahli Bank of Kuwait
| 39,174,000
| 53,178,000
| 35.70%
| |
Ahli United Bank -Kuwait
| 14,261,926
| 27,444,454
| 92.40%
| |
Kuwait International Bank
| -8,234,751
| 16,753,998
| 303.50%
| |
Burgan Bank
| 6,211,000
| 4,655,000
| -25.10%
| |
Kuwait Finance House
| 118,741,453
| 105,983,049
| -10.70%
| |
Boubyan Bank
| -51,694,899
| 6,109,904
| 111.80%
| |
Total Banking Sector
| 355,757,675
| 575,404,557
| 61.70%
| |
Kuwait Investment Co.
| -13,538,650
| -3,052,528
| 77.50%
| |
Commercial Facilities Co.
| 14,267,000
| 17,142,000
| 20.20%
| |
International Financial Advisers
| -16,797,135
| -18,261,000
| -8.70%
| |
National Investment Co.
| -26,076,453
| 4,426,415
| 117.00%
| |
Kuwait Projects Co. (Holding)
| 36,810,000
| 45,027,000
| 22.30%
| |
Al Ahlia Holding Co.
| -52,583,166
| -21,857,522
| 58.40%
| |
Coast Investment & Development Co.
| -13,669,997
| 5,799,505
| 142.40%
| |
Securities Group Co.
| -9,907,674
| 2,746,298
| 127.70%
| |
International Finance Co.
| 121,446
| -6,771,893
| NM
| |
Kuwait Financial Center (Markaz)
| 2,573,000
| 8,123,000
| 215.70%
| |
Kuwait & Middle East Financial Investment Co.
| -9,442,597
| -8,912,327
| 5.60%
| |
Al Aman Investment Co.
| -17,618,815
| -8,135,716
| 53.80%
| |
First Investment Co.
| -22,902,568
| -10,528,607
| 54.00%
| |
Al-Mal Investment Co.
| -12,363,566
| 12,016,616
| 197.20%
| |
Bayan Investment Co.
| -19,347,728
| -12,763,984
| 34.00%
| |
Global Investment House
| -148,826,000
| -73,206,000
| 50.80%
| |
OSOUL Investment Co.
| -3,877,674
| -583,261
| 85.00%
| |
KIPCO Asset Management Co.
| 6,137,656
| 1,820,093
| -70.30%
| |
National International Holding Co.
| -5,130,989
| -7,055,934
| -37.50%
| |
Housing Finance Co.
| -14,950,007
| -362,284
| 97.60%
| |
Al-Deera Holding Co.
| -11,965,841
| -12,975,981
| -8.40%
| |
Al Safat Investment Co.
| -16,136,030
| -29,509,151
| -82.90%
| |
Al Salam Holding Group Co.
| 289,535
| -2,365,689
| -917.10%
| |
Ekttitab Holding Co.
| -14,948,637
| -5,932,691
| 60.30%
| |
Al Qurain Holding Co.
| -33,874,637
| 559,070
| 101.70%
| |
Al-Madina for Finance and Investment Co.
| -9,529,443
| -8,242,883
| 13.50%
| |
Tamdeen Investment Co.
| 2,266,116
| 3,440,249
| 51.80%
| |
Kuwait Bahrain International Exchange Co.
| 767,106
| 661,501
| -13.80%
| |
Damac Kuwaiti Holding Co.
| -4,613,675
| -2,764,759
| 40.10%
| |
Kuwait Syrian Holding Co.
| -2,071,056
| 437,265
| 121.10%
| |
Strategia Investment Co.
| -4,677,883
| -952,256
| 79.60%
| |
Kuwait China Investment Co.
| 8,683,587
| 4,619,031
| -46.80%
| |
Manafae Investment Co.
| 87,980
| -941,358
| NM
| |
?Gulf North Africa Holding Co.
| 1,200,273
| 285,411
| -76.20%
| |
Amwal International Investment Co.
| 144,107
| -6,754,786
| NM
| |
Al Masar Leasing & Investment Co.
| -3,906,165
| -3,271,873
| 16.20%
| |
Total Investment Sector
| -415,408,580
| -138,099,029
| 66.80%
| |
Kuwait Insurance Co.
| -6,235,487
| 3,896,914
| 162.50%
| |
Gulf Insurance Co.
| 5,049,396
| 7,692,395
| 52.30%
| |
Al Ahlia Insurance Co.
| 8,163,108
| 8,275,439
| 1.40%
| |
Warba Insurance Co.
| 1,682,744
| 2,580,189
| 53.30%
| |
Kuwait Reinsurance Co.
| 914,456
| 1,987,930
| 117.40%
| |
First Takaful Insurance Co.
| 77,724
| -1,418,341
| NM
| |
Wethaq Takaful Insurance Co.
| -5,469,718
| -866,457
| 84.20%
| |
Total Insurance Sector
| 4,182,223
| 22,148,069
| 429.60%
| |
Kuwait Real Estate Co.
| 2,137,820
| -20,711,917
| NM
| |
United Real Estate Co.
| 3,787,531
| 5,553,462
| 46.60%
| |
National Real Estate Co.
| 29,520,104
| -34,448,895
| -216.70%
| |
Salhia Real Estate Co.
| 7,248,686
| 10,203,837
| 40.80%
| |
Pearl of Kuwait Real Estate Co.
| -9,542,591
| 57,497
| 100.60%
| |
Tamdeen Real Estate Co.
| 2,702,706
| 4,625,117
| 71.10%
| |
Ajial Real Estate & Entertainment Co.
| -6,206,181
| 42,067
| 100.70%
| |
Al Massaleh Real Estate Co.
| 81,592
| 2,375,885
| NM
| |
Arab Real Estate Co.
| 2,198,321
| 484,384
| -78.00%
| |
Union Real Estate Co.
| 1,276,940
| 1,308,860
| 2.50%
| |
Al-Enma'a Real Estate Co.
| -8,321,192
| 673,950
| 108.10%
| |
Mabanee Co.
| 15,309,794
| 18,670,135
| 21.90%
| |
Injazzat Real Estate Co.
| -20,196,665
| 1,299,944
| 106.40%
| |
Jeezan Holding Co.
| -3,886,813
| -4,653,007
| -19.70%
| |
Investors Holding Group Co.
| -14,893,314
| -19,880,299
| -33.50%
| |
International Resorts Co.
| -3,303,592
| -2,512,923
| 23.90%
| |
The Commercial Real Estate Co.
| 19,056,592
| 5,551,428
| -70.90%
| |
Sanam Real Estate Co.
| -969,012
| -6,163,666
| -536.10%
| |
Aayan Real Estate Co.
| 3,089,435
| 1,857,945
| -39.90%
| |
AQAR Real Estate Investment Co.
| -1,321,625
| 118,803
| 109.00%
| |
Kuwait Real Estate Holding Co.
| -9,044,918
| -4,173,376
| 53.90%
| |
MAZAYA Holding Co.
| 5,153,053
| -8,609,811
| -267.10%
| |
Al Dar National Real Estate Co.
| -14,214,899
| 129,318
| 100.90%
| |
Grand Real Estate Projects Co.
| -25,883,314
| -23,709,296
| 8.40%
| |
Tijara & Real Estate Investment Co.
| -4,893,471
| -2,645,447
| 45.90%
| |
Al Taameer Real Estate Investment Co.
| -4,813,046
| 95,832
| 102.00%
| |
Al Argan International Real Estate Co.
| 3,362,769
| 3,983,208
| 18.50%
| |
Abyaar Real Estate Development Co.
| -29,247,558
| -4,996,913
| 82.90%
| |
First Dubai For Real Estate Development Co.
| -15,532,727
| -21,763,054
| -40.10%
| |
Kuwait Business Town Real Estate Co.
| -10,722,426
| 350,521
| 103.30%
| |
Manazel Holding Co.
| -15,477,712
| -4,912,445
| 68.30%
| |
Real Estate Asset Management Co.
| 756,498
| 546,974
| -27.70%
| |
Mena Real Estate Co.
| 2,993,530
| 399,906
| -86.60%
| |
?Al Mudon Real Estate Co.
| 136,850
| 310,224
| 126.70%
| |
Total Real Estate Sector
| -98,458,693
| -95,087,940
| 3.40%
| |
National Industries Group (Holding)
| -23,187,000
| -19,200,000
| 17.20%
| |
Kuwait Pipe Industries & Oil Services Co.
| -5,190,913
| 387,069
| 107.50%
| |
Kuwait Cement Co.
| 12,813,242
| 13,358,087
| 4.30%
| |
Refrigeration Industries & Storage Co.
| -3,332,794
| 1,067,211
| 132.00%
| |
Gulf Cable & Electrical Industries Co.
| 10,523,602
| 26,403,034
| 150.90%
| |
Heavy Engineering Ind. and Shipbuilding Co.
| 4,866,413
| 4,837,309
| -0.60%
| |
Contracting & Marine Services Co.
| 3,532,072
| 2,033,907
| -42.40%
| |
Kuwait Portland Cement Co.
| 12,174,227
| 22,289,458
| 83.10%
| |
Shuaiba Industrial Co.
| 1,668,796
| 1,200,314
| -28.10%
|
Kuwait Market Performance
2008 the Golden Year
?
| Price KD 31st Dec 2007
| P/E( EPS) 06
| Earnings Growth 2008
| Target P/E 2008
| Target Price
| Change
| |
|---|---|---|---|---|---|---|---|
Mobile Telecommunications Company K.S.C
| 3.82
| 23
| 37%
| 19
| 4.32
| 13%
| |
Kuwait Finance House
| 2.82
| 30
| 36%
| 21
| 2.61
| -7%
| |
National Bank of Kuwait S.A.K.
| 2.02
| 19
| 8%
| 16
| 1.86
| -8%
| |
National Industries Group Holding
| 1.66
| 14
| 52%
| 11
| 2.06
| 24%
| |
Gulf Bank
| 1.74
| 18
| 8%
| 15
| 1.64
| -6%
|
Kuwait
