Measures of Success for Service Oriented Companies

Introduction
While many companies have measures of success, you, the company owner of a service-oriented business, should have your own measures. These measures can be leading or lagging. You should be using these measures to drive profitability and success!
Many organizations track either leading or lagging indicators. Few do both. Both are necessary to keep your eye on the prize of greater revenues, lower costs, more and better customers, and more. Your repeatable formula, for any measure, follows a pattern every time:
- Measure the count
- Measure the percentage (that’s the margin or the rate)
- See your percentage trend up or down
- Find out why you trend the way you do.
Finding out why is the golden nugget you must find, because when you know why, you can change it in your favor and drive a higher company performance.
In this article, I’ll highlight a few of the indicators you will need in your service business to drive your business performance higher.
Lagging Indicators - Financial
Revenue or Revenue Growth over Time
Revenue and revenue growth will tell you how you did in the past and how you are trending, up or down, when it comes to growth. As long as you are trending up, you are on the path to revenue growth. The key information to know is WHY you are trending they direction you are. Knowing WHY will allow you to adjust your operations to see revenue trend upward.
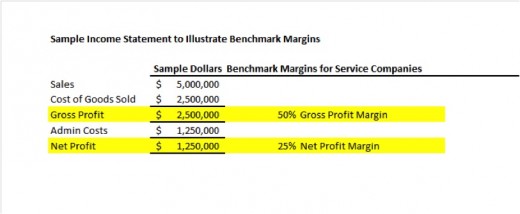
Gross Margin
Gross margin means your profit, as a percent of revenue, after your costs of serving your customer, but before you deduct your company operating expenses. A well operating service company should see a gross margin of 50% or more. If you are below 50%, you have some work to do to make improvements.
Net Margin
Net margin means your profit, as a percentage of revenue, after your cost of serving your customers and after your cost of operating the company. A good service company should be between 20% and 25%. If you are below this, or on the low end of the range, you have some work to do to make improvements.

Leading Indicators-Financial and Nonfinancial
Marketing
Website traffic
Your website traffic is an indicator of your future sales. It may not look like it, but a fraction of the website traffic you see will be your future customers. How well you attract, entertain and engage your customers on your website will impact your conversion of traffic to customer.
Inbound telephone calls
Telephone calls to your company are also an indicator or future sales. Just like website traffic, a portion of your incoming phone calls can be predicted as future customers. Knowing what that fraction is can lead you to find ways to better talk to customers on the phone so your future sales can grow.
Telephone call conversion rate
If you are able to measure how many phone calls come in to your company, and relate that number to your new customers each month, you can find out your conversion rate. Make no mistake about it, conversion rates, when they are improved, can have an explosive increase on your sales!

Sales
Incoming Leads
This is a measure of your count of incoming leads, no matter where they come from. Knowing this can lead you to monitor the success of your marketing campaigns. It can also lead you to laying the foundation for your lead conversion rate, because without knowing how many leads are coming in, you will never know your lead conversion rate.
Lead conversion rate
Your lead conversion rate is the percentage of leads that become sales. It is a highly important measure of your future sales. Today’s conversion rate, measured against next month’s incoming leads can predict your sales next month. If you can find the right way to up your lead conversion rate, you can exponentially increase your sales.
Up sell conversion rate
This conversion rate is all about knowing how many of your customers want to purchase additional services, beyond your introductory service. It will predict your future sales very well. Knowing what to do to improve this conversion rate will also allow you to exponentially increase your total sales.

Service
Average revenue per customer
Measuring the average revenue per customer allows you to know if any of your upcoming service days, whether for one member, or for your entire workforce, is a profitable day, BEFORE IT BEGINS! If your workday is not profitable, you will need to make adjustments so it is!
Uptime rate
Any one member, or your entire workforce, has an uptime percentage. This is the amount of actual revenue generating service time, as a percentage of the total time available. Knowing what this rate is will tell you if you are efficiently using your workforce to generate revenue. You should be between 70% and 80% on average. Don’t expect 100% because this is not possible over long periods of time due to the many reasons for employee time off.
Repeat service rates
You should know what percentage of your customers return to you for more service, after a previous service is given. Knowing this will allow you to know your service team’s quality of work and predict future sales.
Executive Summary
Knowing these measures of success allows you to set goals to improve one or more measures in a positive way. Doing this could mean dramatic growth for you and your company!
It doesn’t matter what you measure: Marketing, Sales, Service, or the many other possible measurements. The formula to follow is always the same:
- Measure the counts
- Measure and trend the percentage
- Look for up/down trends in your percentages
- Find out why
- Make changes that cause strong up trends. Positive changes in percentages have explosive results
- Watch your company grow