Pareto's observation on income distribution (the winner takes it all)
Wilfredo Pareto (1848-1923) was an Italian economist and sociologist, who is known for his work on the distribution of richness in a society and '80/20 principle', among the other things. In 1909 he found an remarkable pattern of the distribution of wealth and published this results in a scientific paper.
Although this finding is usually known as Pareto's law, we titled this article as 'observation' in order to emphasize that this is rather description of a socio-economical phenomenon than a rule in a usual sense of term 'physical law'.
The observation
Pareto aimed to find out how the wealth is distributed in a community. The first problem that Pareto had faced is how to measure someone's property, especially in a situation of the unavailability and lack of relevant data. Pareto decided to use a tax records and personal income as a relevant yardstick of an asset and he succeeded to collect that data through different country and towns as well as different centuries. More precisely, he collected tax records of Basel (Switzerland) from 1454, from Augsburg, Germany from 1471, 1498 and 1512; then personal income from Britain, Prussia, Saxony, Ireland, Italy and Peru.
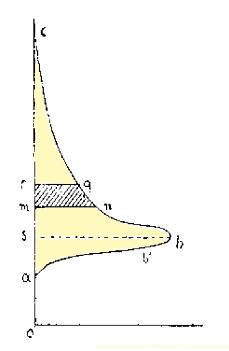
The finding was unbelievable! When he plotted the data on a diagram, with income level on a vertical axis and the number of people on horizontal axis – he saw the same pattern in every data sample. This graph is shown on the figure above. As one can see, the basic characteristic of the distribution is that there is majority of the population with quite low income – the bottom of the graph. There is few individuals with extremely large income and very few ones with income close to zero.
Precisely, the majority of population has an income around the amount noted by the interrupted line (β, slightly above α). So beta is mode income, i.e. the income that appears the most often in a sample. Among the population there are b individuals with this income. The number of people with an asset between levels m and p is represented by a shaded area.
The 80/20 principle
Pareto noticed that:
80% of land in Italy was owned by 20% of the population!
Generalization of this principle, that says that, let's say, 20% of effort leads to 80% of effects (while the next of 80% should be invest for the rest of 20% of achievements) is known as Pareto Principle, 80-20 Principle and sometimes as Pareto Law.
What was even more striking, Pareto found that the distributionn has the same shape regardless on a country i.e. a type of government, regardless on time and regardless on the size of sample – i.e. the shape is the same for country, province or a city.
While here we are primarily concentrate in a mathematical aspect of this phenomenon, Pareto's aims were more wider. In the book "The Misbehavior of Markets", B. Mandelbrot, the father of fractal geometry and a connoisseur of Pareto's work, says "Pareto was fascinated by the problems of power and wealth. How do people get is? How is it distributed around society? How do those who have it use it?"
We are going now to see how this rule can be written algebraically. For this purpose, firstly we will study the basic fact of exponential function.
The power law in logarithmic scale
The power law is any physical law described by an exponential function f(x)=axα. The main property of power laws is their scale invariance. This means that scaling the argument x by a constant factor c causes a proprtianate scaling of the function itself: f(cx)=a(cx)α= cαf(x).
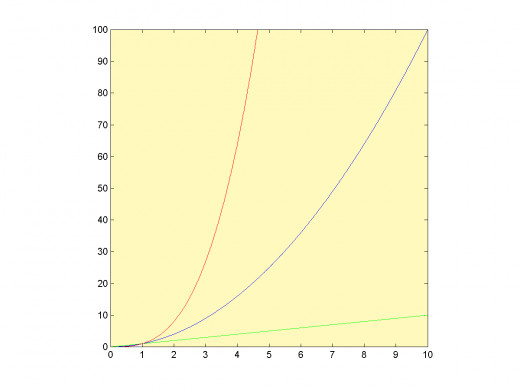
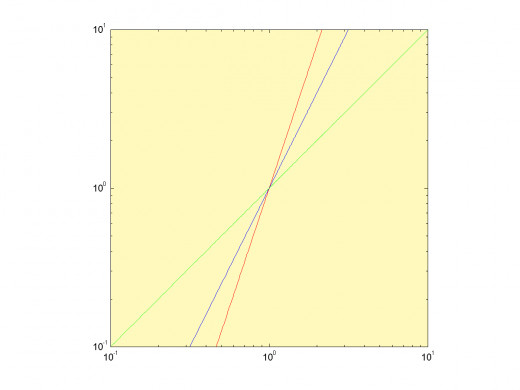
Further interesting property of such a function is that its graph in a logarithmic scale is a line. On the next figure we see well known graphs of two instances of exponential function, f(x)=x2 and g(x)=x3, togather with an linear function f(x)=x. As we know, in both cases the growth is faster than in a linear case; and the growth of cubic function is even faster then in quadratic case. However, if we draw these functions in a diagram with logarithmic axis, then a graph will be a line with a property that a slope of line represents a growth rate.
One can easily convinced ourselves that this fact hold in general i.e. for any exponential function. Namely, it holds:

In order to get some impression on power law let state some instances. An example is the Third Kepler's law, relating the orbital periods of two planets. Having any two planet in a given planetary system the ratio of square of periods is the same as the ratio of cube of major semi-axis. Another example can be Stefan-Boltzmann law, describing the black body radiation. It states that total energy radiated per unit surface and per unit time is proportional to the forth power of black body's temperature. (Let mention that black body is an idealization in physics, a good approximation of black body are stars.)


Algebraic form of Pareto's observation on income distribution
Known just a distribution shape of richness in a society is not enough to mathematically deal with a found pattern. It can be shown that the pattern can be very well described with an algebraic form. Let m be minimal annual income while u is an income of an individual in a population. Let P(u) be a share of individuals with income greater than u or equal to u. Then the next relation holds.

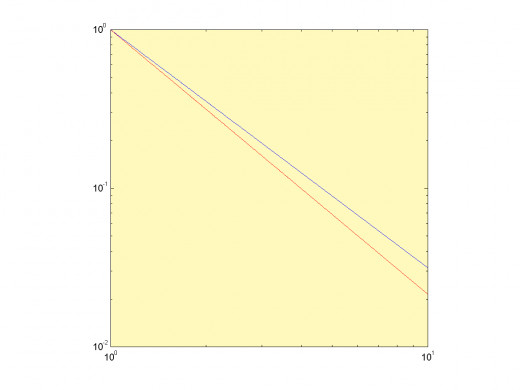
Pareto held that the parameter α in the relation don't depend on the observed society and he estimated its value to α=3/2. However, further researches has shown that α depend on the sample and usually its value is closer to 2 than to 3/2. The next figure shows the graph of function P(u) for α=3/2 (blue) and α=5/3 (red).
Order
| Word
| Appearances
|
|---|---|---|
1
| you
| 1222421
|
2
| I
| 1052546
|
3
| to
| 823661
|
4
| the
| 770161
|
5
| a
| 563578
|
225
| mother
| 16855
|
233
| father
| 16233
|
280
| happy
| 12788
|
286
| friend
| 12245
|
459
| walk
| 6619
|
923
| evidence
| 2514
|
Frequencies of English words on a sample based on 29.213.800 words from TV and movie (source Wictionary).
The broader context - do we have a normal distribution in socio-economic phenomena?
Although the bell shape Gaussian distribution is known as 'normal' distribution, which can suggest some standard among the distribution, actually this type in distribution is very rare in the nature. Its importance is more related to its beautiful mathematical properties rather then to the presence in nature or society. N. Taleb, the author of two very popular books ('Fooled by Randomness' and 'The Black Swan'), says 'Randomness of Gaussian type is not present in socio-economic phenomena'.
Instead, it seems that the asymmetric distribution of income found by Pareto is a prototype for socio-economic phenomena. For example, the usage of word in an language is not normally distributed but, as we know, there are few words very frequently used while some of them we need extremely rarely. The table above illustrate this fact, presenting frequencies of English words on a sample based on 29.213.800 words from TV and movie (source Wictionary).
Note the huge difference between these types of distribution: while within symmetric distribution the term average is meaningful in case of unsymmetrical distribution it can be misleading. It is obvious that for asymmetric distribution like already described one, mode and median are much better description than the average. Moreover, for some distribution average can't be mathematically defined.
Where is your 'position' on Pareto's graph?
Case study
How many extra rich persons is expected in a country
Imagine a country of 10 million of citizens. Furthermore, let imagine the minimal annual income in this country be 12000 USD. Let estimate the number of people with income greater than 12 mil. USD per year. Let α be 3/2 just as Pareto firstly thought.
In order to find the solution, firstly we have to find P(u) where u is 12000 USD. After a short calculation using the algebraic expression above, it follows that P(12 mil.USD) is equal to 3.126*10-5. At least, we have to multiply this figure with the population of a country i.e. with 10 millionss, which lead us to the final result of approximately 316 individuals.
As a variation of this exercise let assume that the value of α is 5/3, which is more realistic according to the certain researches. Would in this case the number of person with income greater than 12 mil. be smaller or greater than in previous case? It can be easily shown that P(u) will be as smaller as α is greater i.e. closer to the number 2. In that case there is less extremely reach persons in a society. Concretely, in our exercise with a short calculation one can find the number of approximately 100 persons with an annual income greater than 12 mil. USD.

Summary
In 1909 an Italian scientist Wilfredo Pareto's published results of his research on income distribution.
When put tax record of several countries and towns, including Basel, Augsburg, Italy, Peru etc., in 1909 Pareto found a striking pattern. In every sample, regardless on
- government type,
- time and
- the size (country, province, town)
the shape of distribution of income among population was the same.
- There were few person with very high income level while the majority of population has quite low income.
- Although in the literature this result is known as 'Pareto's law' we titled this article 'Pareto's observation' since this result is rather description of a phenomenon than a law in an usual means of term 'law' in mathematics or physics.
- Mathematically, his observation can be described by the relation that is type of power law. The distribution is not a Gaussian one.
-
It seems that the bell shape distribution (Gauss distribution) is not present in socio-economic phenomena at all.

