Prioritizing Project Risk: Qualitative Risk Analysis & Assessment
Prioritizing Project Risk in a Nutshell
Some risk events are more likely to occur than others. And some are more costly than others if they do occur. Assessing these two elements: likelihood of event and severity of consequence, we prioritize our risk list and decide which risk items to address.
Not on My Vacation!

Creating the Prioritized Risk List
Risk Management is the process of bringing risk under control and keeping it under control through the project. Risks are what could prevent project success; keeping risks under control ensures success. The first step in bringing risk under control is to Risk Identification.
Once risks have been identified, we need to define them more clearly and then prioritize them. That is the focus of this article.
We define each risk clearly so that we can keep it under management throughout the project. We evaluate the likelihood and significance of the risk so we can prioritize them. Time is limited, and we may not be able to address every risk we thought of in risk identification. So it makes sense to focus our attention on the risks that matter most.
Risk Planning for the Family Vacation
"Boy, I've been working really hard, and I'm exhausted. I'm really looking forward to going up to the lake and hiking in the woods with my wife and the kids. But I'm so exhausted, and the kids could get sick."
Those three sentences are a project plan for a great family vacation, and the beginning of a risk plan, as well. So I go to my wife. I ask her if she's up for the trip. She says, "Honey, I'm fine. After all, I only work 80 hours a week and take care of three kids. I'm doing great and ready to go. But what if the car breaks down?"
Glad I married SuperMom, I expand risk identification work with a proactive worry session. The family has fun remembering the miseries of past trips, and my son gets excited by possibilities of disaster. We develop this further with project risk analysis and assessment. To keep it simple, we won't list all the possibilities. A representative sample is shown in Table #1, The Family Vacation Risk List.
Define Each Risk Clearly
In our Risk Identification process, we kept it simple. We said, "This might happen." Our focus was on a long list, not on understanding each item.
Now, we return to each item, understand it, and define it clearly. To define a risk item, we want to know these five things:
- Risk name. We give each risk a unique name, to avoid confusion.
- Trigger. We identify an event we can see that would say, "the risk is likely to happen" or "this risk is happening for sure."
- Consequence. If the risk even does happen, what kind of damage will it cause? Consider these possibilities: Project cancellation; increased cost; delay in time; reduction in features; reduction in quality.
- Likelihood. A rating of how likely the event is to happen.
- Significance. If the risk does happen, how much damage does it cause to the project?
Note these points:
- Risk name, trigger, and consequence are all descriptions, written as words.
- Likelihood and significance are numeric ratings.
- Likelihood and significance are independent of one another, one can be high while the other is low, or both can be high, or both low.
Analyzing the risk - simply thinking about it - gives us the name, trigger, and consequence. Assessing the risk - giving it ratings - fills in likelihood and significance. These are illustrated in the sidebar, Risk Planning for the Family Vacation, and the results are shown in Table #1: The Family Vacation Risk List.
Table #1: The Family Vacation Risk List
#
| Risk Name
| Trigger
| Consequence
| Likelihood
| Significance
|
|---|---|---|---|---|---|
1
| Dad gets sick
| Sleeplessness
| Trip cancelled
| 0.7
| 1
|
2
| Kid gets sick
| Sneezing
| Trip cancelled
| 0.3
| 1
|
3
| Car breaks down
| We get in the car
| Lost day
| 0.3
| 0.5
|
4
| Bugs eat us alive
| We arrive at camp site
| No fun
| 0.7
| 0.3
|
5
| Injury while hiking
| We go hiking
| No fun
| 0.2
| 0.7
|
6
| Boulder Crushes Cabin
| Landslide
| Death
| 0.1
| 1
|
Turning our worries into a clear risk list is pretty easy!
Statisticians Like Zero, One, and Everything In Between
For complicated mathematical reasons we don't need to go into here, statisticians like rating scales from a low of zero to a high of one. In casual conversation, we might say "on a scale of one to ten" or "on a scale of one to five." But if we want a statistician to help us out (and we might, for more advanced risk assessment), we want to adjust those scales to between zero and one. So, if we think we might use numbers, these are good scales:
- Likelihood: from zero (can't happen) to one (sure to happen). But since all risk events are uncertain, we enter a number between 0.1 and 0.9. A zero can't happen, and we don't need to plan for it. A one will happen, and it is not a risk, it is an issue in the main project plan.
- Significance: from zero (no harm done) to one (cancels the project). If delay is the big issue, then a two-week delay in a 5-week project is a 0.4. If cost is the big issue, than a $2,000 increase in cost on a $10,000 project is a 0.2.
Rating Each Risk
We look at each risk separately, and rate it in two independent ways:
- Likelihood. We ask, how likely is this to happen? And we put the results in the Likelihood column.
- Significance. We ask, how much damage would this do? If it cancels the project, it's a 1.0. Otherwise, we define a proportional rating by increase of cost, amount of delay, reduced scope, or reduced quality.
Once we've rated each item, we look at the table, and read through it, and make sure everything makes sense. Then we sort it by likelihood and say, "Does this make sense?" For example, if we said that it was more likely that a boulder would crush our cabin than our car would break down, we need to adjust the numbers. Then we do the same with the significance column.
At this point, we understand the risks, and their likelihood and consequence. We've done a good job analyzing and assessing the risks. Now, it's time to prioritize them.
Creating the Risk Factor
Right now, we have two independent ratings, Likelihood and Consequence. Ranking the risks list, highest to lowest, by each rating, is a valuable thing that you can do. Try it out in Table #1, which is a sortable table.
It would be even more valuable if we had a single number for each item, so we could make one sort that would prioritize the list. We can do that by creating a risk factor. The equation is simple:
risk factor = Likelihood * Significance
You can see the results in Table #2: The Prioritized Family Vacation Risk List, which has the Risk Factor column added on the right, and is sorted by highest risk factor first. Note that the items are no longer in the original order, items 3 and 4 have switched places. You can sort the table and see how it changes if you sort by Risk Factor, Likelihood, or Consequence.
Setting Up to Work Statistically
I used a range of zero to one (0 - 1) for both Likelihood and Significance. Then I multiplied them together to create the Risk Factor. As a result, the lowest risk factor is zero, and the highest is 1. (Here's the logic: Zero times zero is zero; One times one is one; anything else falls in between.) This means that all our ratings, and all of our scales based on ratings, can be on a scale from zero to one. Now you know a little of why statisticians like doing things this way: It keeps the math simple.
However, in some business environments, numbers, especially fractions, are scary or complicated. In that case, we may want to present our risk results in color.
Table #2: The Prioritized Family Vacation Risk List
#
| Risk Name
| Trigger
| Consequence
| Likelihood
| Significance
| Risk Factor
|
|---|---|---|---|---|---|---|
1
| Dad gets sick
| Sleeplessness
| Trip cancelled
| 0.7
| 1
| 0.70
|
2
| Kid gets sick
| Sneezing
| Trip cancelled
| 0.3
| 1
| 0.30
|
4
| Bugs eat us alive
| We arrive at camp site
| No fun
| 0.7
| 0.3
| 0.21
|
3
| Car breaks down
| We get in the car
| Lost day
| 0.3
| 0.5
| 0.15
|
5
| Injury while hiking
| We go hiking
| No fun
| 0.2
| 0.7
| 0.14
|
6
| Boulder crushes cabin
| Landslide
| Death
| 0.1
| 1
| 0.10
|
This table is sorted by highest risk factor, but you can sort it any way you like.
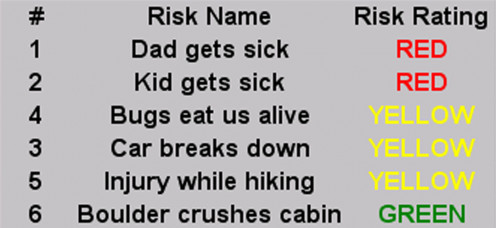
Figure #1: The Color-Coded Family Vacation Risk List

Color Presentation: Red, Yellow, and Green
Colors for presenting Risk Management are very simple:
- High risk items are red, and a red alert means: Watch out! Deal with this one!
- Moderate risk is yellow, and a yellow alert means: Keep an eye on this one!
- Low risk is green, and green status means: This is okay, it's not a big deal. But it's on the list, so don't forget about it all together.
See Figure #1: The Color Coded Family Vacation Risk List to see how this plays out. By the way, you can create color-coded presentations like this using Microsoft® Excel's Conditional Formatting feature.
The Result: A Prioritized Risk List
We've got our prioritized risk list, and we can present it in colors that every kid - and even every senior executive - can understand. A prioritized, sortable risk list like this can be called a risk register.
Now what do we do with it? That's a great question. There's one thing we don't want to do, and that's do nothing. One time, I was training a business owner in project management, and he got a call from his office. His assistant had constructed a new, expensive network server for a client, and was driving it across town for delivery, and he got into a car accident. Fortunately, no one was injured. Well, no person was injured. But what about the computer? They had to take it back in for several hours of testing, which meant delivering late and disappointing the client.
When he hung up the phone, the business manager said to me, this is what bother's me. I asked my guy, "Did you think this might happen?" And he said, "Yes, I thought it might." So I said, "So what did you do about it." And he said, "Nothing. I just thought it might happen."
That's where we are, if we stop now. A prioritized, color-coded risk list is a delightful thing to have. It's really valuable. But, just like a color-coded road map that we leave at home; or a chart of dangerous reefs we leave on the dock; our risk list is useful if we don't take it with us on our project. To take it with us, we need to do two more steps:
- We decide what to do about each risk with Project Risk Response Planning.
- We carry that plan forward into our project and manage risk week by week through the whole project with Risk Monitoring and Control.


