American Dream: The Rewards of Labor vs Good Life From Inheritance

Vautrin's Lesson
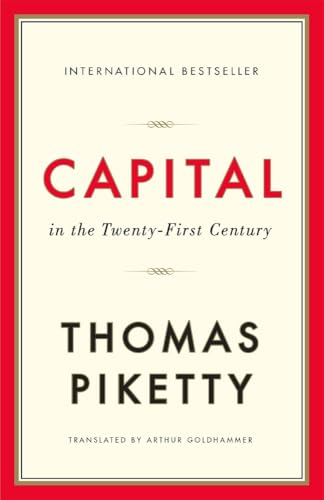
i HAVE BEEN WORKING MY WAY THROUGH THOMAS PIKETTY'S, a French economist, latest book titled Capital in the 21st Century; I am at page 238 of 577, plus notes and appendices; there it is to the right. His work is unique in that it takes a 310-year look at economic activity worldwide, a long enough time span, encompassing enough major events, to determine very long-term movements in economic data.
Specifically, the section which contains page 238 begins to look at capital and labor income inequality. Vautrin's Lesson concerns income derived from inheritance relative to income derived from labor. Vautrin is a criminal in Balzac's 1835 novel Père Goriot. He is counseling Eugene de Rastignac, a "penniless" (after his family's estate pays essential expenses) young French noble staying at the same boarding house. Also residing there is Mademoiselle Victorine, a shy young woman, who is the illegitimate daughter of a wealthy man, who has taken a liking to Eugene; she also has access to a million francs, but only if her brother dies. For a commission and a share of the booty, Vautrin offers to off the brother for Eugene; who originally only wanted to get a law degree and become a lawyer or judge. (For perspective, a million francs might return about 50,000 francs/year in capital income which is about 100 - 170 times average wage income of the time, or around 250 - 450 francs/yr.)
While Piketty takes a few pages of small type to develope this part of Balzac's story, I will shorten it still further. In essence Vautrin tries to reason with Eugene by pointing out, truthfully for 19th Century France (or any other society including ours) that the realistic expectation of making it BIG from the fruits of ones own labor are slim to none.. If Eugene ever hopes to live the life of a real noble, being a lawyer or a judge will never get him there. His ONLY hope is to marry into it, in this case by marrying Mademoiselle Victorine and letting Vautrin kill her pesky brother.
Fortunately for the brother, morality wins out over greed and Eugene chooses not to have the brother killed; I don't know if he marries Victorine anyway.
Capital in the 21st Century
A Short Aside
AS MOST OF MY FOLLOWER KNOW, MOST OF THE HUBS I write are ones where I derive my conclusions from the logic use of available data. I lay bare my methodologies and sources and get into the why's, wherefor's, and steps leading to my final results which, unfortunately can lead to gory detail that bores many readers to death, especially if you are inclined to fall asleep when numbers appear; many people are simply hard-wired that way.
But, I have found that many people nevertheless appreciate the effort because they see that I don't simply "proclaim" things to be true and factual, or refer the royal "them" as proof the truth of my assertion. Further, while some of my Hubs are to vent and give opinion, most are to try to convince someone. Now I am aware that there are those who may read me, but rarely agree with what is said and can't ever be persuaded to do so, regardless of how compelling a case I can bring. I am happy, however, to have these readers to take the time to do so because this is the only way my work can get critiqued. They are motivated to find and point out flaws in my logic or errors in my data, And when assertions I make are based on one or the other or both and is found to be untenable, I am not wed to it; when this has been the case, I have been known to modify, drop, or even reverse my assertions.
Then there is another group to whom I am "preaching to the choir" and who don't need any convincing; for this group I am appreciative of that and look for advice on how to improve my presentation. It is the remaining group who I am hoping will find all of these charts, tables, logic, and words I have put together, which I pray are organized and presented in such a way as to make an understandable case, useful in persuading them as to the efficacy of the points I am trying to make, Once all of the data and logic is laid out and shown how it points to the conclusion I have come to, it is up to the reader to ultimately decide if they agree or not, or if I have simply bored them to tears.
Income from Capital vs Income from Labor
PRIOR TO WW I, THE WORLD WAS PRETTY MUCH LIKE BALZAC described in Père Goriot. This includes the United States, just to a lesser degree; and hardly at all in frontier areas where America was still expanding. The clear implication of Vautrin's Message is that there was no hope of upward mobility based on talent and hard word alone; it just couldn't be done. In order to live high (or even middle)-on-the-hog you either had to be born into wealth or marry into it; you couldn't work your way into it; it was almost mathematically impossible. Why was this true?
First, I need to make clear, that unlike the period after WW I, there was virtually no stigma attached to living off of one's inheritance. In fact, in Europe, and to a much less degree in America, it was expected. It was OK not to earn your living, a concept that seems very foreign to us today. This was true of both women and men. Sexist or not, this view still holds, to a large degree for women (by men) but it seems almost wimpish for men to do the same. In any case, that sets the stage for a discussion about wages and "rents", a term Piketty insists on using, from capital; I will use the term "income".
National income comes from two sources, 1) income from labor and 2) income from capital. There is also a ratio β (capital/income) that divides something called National Capital by National income. Now, before I go further, let me define a few things that you will need to know to understand all of this:
- Income from Labor: Wages of any sort plus non-wage remuneration for work performed
- Income from Capital: Any income derived from the possession of Capital Assets, e.g. profits, dividend, interest, rents, capital gains, etc
- Capital: Essentially anything one can possess and utilize, and for which a price can be developed; e.g., equipment, stocks, cash, factories, etc.; this excludes humans who are not slaves or indentured servants and raw, unworked land
- Capital-Income Ratio (β): The ratio of the market value of National Capital divided by National Income
- Growth Rate (g): Annual, long-term growth in productivity plus population
- Savings (s): Annual net national savings rate of both individuals and businesses
- Capital Portion of Income (a): That part of income derived from Capital
- Labor Portion of Income: This is 1 - a.
- Capital Rate of Return (r): e.g., a bond that returns r% per annum.
- Labor Inequality - Table 1
- Capital Inequality - Table 2
There are also two fundamental relationships one must understand as well to make any sense of this:
- β = s/g (which says that over the long-run, the Capital-Income ratio is the savings rate divided by growth rate)
- a = r * β (which says that the share of income from Capital is simply the Capital-Income ratio times the rate of return from Capital)
So, with the above as a foundation, we can then proceed to see why Vautrin's message can was very true in the time his character was created; why, in those days, labor only got you a sense of moral superiority and not much else.
Let's Add Some Numbers
I WILL TRY TO KEEP THIS AS SIMPLE AS POSSIBLE, given numbers and hubs don't mix well. Nevertheless, the results of this section will be used in the next to show in what situations it is pointless to expect great wealth from hard work, i.e., when the American Dream is essentially unachievable. Having said that, you can skip this section for now and move directly on to the next, and then refer back to this one if you feel the need.
First, let me explain Tables 1 and 2 below a little bit. Each table has four stratifications, 1) the top 1% of earners, 2) then next 9%, 3) the "middle 40%, and 4) the remaining 50% of wage earners (meaning a full 1/2 the population). The fifth row is something called the Gini Index, a measure of inequality that I like as a general statistic but Piketty doesn't for technical reasons when you take a more detailed analysis of the data. Basically, the larger the Gini Index, which goes from 0 and 1, the more inequality in whatever it is measuring, in this case wages or capital ownership. The columns in each table reflect different time periods throughout history.
Table 1 looks at the distribution of income from wages plus the value of non-wage substitutes, e.g., paid health insurance, stock options. So, it says that an example of low inequality is represented by Scandinavia in the 1970s where the top 1% received only 5% of the national wage income (or 500% of the the mean wage) while the bottom 50% received 35% of the national income (or 70% of the mean wage). On the other hand, if you look at France in 1750s, an example of very high wage inequality, the top 1% receive 17% of the national income (1700% of the mean income), while the bottom 50% get only 20% of national wages, or 40% of the mean wage!! You can see where America falls in 2010.
Likewise, for Table 2 which measures capital ownership, the inequality is even greater, as one would expect. But, when the disparity gets too high, and as we will see later in this Hub (and in much more detail in a future Hub) while the rate of return on capital (r) is normal and growth (g) is low, this can have a disastrous effect on society going forward. Table 2 is read just like Table 1. I just want to point out three things, 1) there is no example of "low capital ownership inequality" in real life, 2) look how in all cases, the bottom 50% of the population possesses virtually no wealth (another term for capital) at all, and 3) it is only with the advent of a true "middle class" after WW II did wealth migrate down from the top to the middle; but not to the bottom. (Note, prior to WW I, you had a merchant class, but not a real middle class as we understand it today.)
For the moment, while we are talking about Vautrin's Message, let's focus on the Very High columns in Tables 1 and 2 as well as β, r, a, (1 - a), and a somewhat arbitrary mean wage of $42,000 and median wage of $27,000. I choose the Very High columns from the tables because they are indicative of the distributions in Vautrin's time frame where we are analyzing income from inheritance (capital) vs income from labor. The mean and median wages are 2012 U.S. wages and keep in the back of your mind the large separation between the mean and median; I will come back to that later.
In the period leading up to WW I, the income and capital inequality picture is that of the right-most column of each table - Very High. Likewise, β was at 700%, meaning the value of national capital was 7 times that of the national income. The return on capital (r) has historically been constant at around 4 - 7%. Using 6% for (r), which was seen during the period of Vautrin's Message, as an average that gives us an (a), or share of income from capital of around 42% (hold this thought). OK, take a breath, and let your eyes come back into focus; all of this actually means something once it is put together.
The next piece took me a little time to work through my head, but once there, it was extremely revealing. For this, we will need Table 3, below.
Labor Income Distribution
INCOME GROUP
| LOW LI INEQUALITY
| MEDIUM LI INEQUALITY
| HIGH LI INEQUALITY
| VERY HIGH LI INEQUALITY
|
|---|---|---|---|---|
Example
| Scandinavia - 1970
| Europe - 2010
| U.S. - 2010
| France 1750 (est
|
TOP 1%
| 5%
| 7%
| 12%
| 17%
|
NEXT 9%
| 15%
| 18%
| 23%
| 28%
|
MIDDLE 40%
| 45%
| 45%
| 40%
| 35%
|
BOTTOM 50%
| 35%
| 30%
| 25%
| 20%
|
GINI INDEX
| .19
| .26
| .36
| .46
|
TABLE 1
Capital Ownership Inequality
INCOME GROUP
| LOW CO INEQUALITY
| MEDIUM CO INEQUALITY
| MEDIUM-HIGH CO INEQUALITY
| HIGH CO INEQUALITY
| VERY HIGH CO INEQUALITY
|
|---|---|---|---|---|---|
Example
| None
| Scandinavia - 1970
| Europe - 2010
| U.S. - 2010
| Europe - 1910
|
TOP 1%
| 10%
| 20%
| 25%
| 35%
| 50%
|
NEXT 9%
| 20%
| 30%
| 35%
| 35%
| 40%
|
MIDDLE 40%
| 45%
| 40%
| 35%
| 25%
| 5%
|
BOTTOM 50%
| 25%
| 10%
| 5%
| 5%
| 5%
|
GINI INDEX
| .33
| .58
| .67
| .73
| .85
|
TABLE 2
DISTRIBUTION OF INCOME AND CAPITAL OWNERSHIP 1700 - 1913
INCOME %
| INCOME $
| CAPITAL OWNERSHIP %
| CAPITAL OWNERSHIP $
| |
|---|---|---|---|---|
MEAN
| $42,000
| $288,000
| ||
Top 1%
| 17%
| $714,000
| 50%
| $11,400,000
|
Next 9%
| 28%
| $130,667
| 40%
| $1,013,333
|
Middle 40%
| 35%
| $36,750
| 5%
| $28,500
|
Lowest 50%
| 20%
| $16,800
| 5%
| $22,800
|
TABLE 3
NEW YORK STOCK EXCHANGE - WALL STREET

OK, Isn't it clear now? NO? I understand. The distribution and the share of capital income (a=42%) is the key to Vautrin's Message. It is key for these reasons:
- Income from capital accounts for almost half of ALL income (actually around 42%, as we saw in the previous section, you can release that thought now.)
- From the right-most column of Table 2, we see that virtually all (90%!) of the capital (non-wage) income is earned by the top 10% of the population
- Because, in that time period, the return on capital (r) is much greater at 6% than economic growth (g) at less than 1%, capital will continue to accumulate at the top because those that earn it only have to spend a small part (say 2 or 3%) of their capital income to sustain their lifestyle; the rest gets reinvested thereby increasing the value of the capital still further. (It is not limitless, however, but it might as well be).
So, what is the implication of that? Well, for every dollar of national income, $0.38 goes to the top 10% in the form of some sort of return on investment (ROI) (and another $.04 to the remaining 90%) while the other $0.58 is spread among, not the rest of the population, but 100% of the population who earn an income through wages or salaries. It gets much worse for our poor hero however. In looking at the rightmost column of Table 1, you see that a full 55% or $0.32 of remaining $0.58 left over for wages go to the to just the top 10% of wage earners as weil. Doesn't this leave just $0.28 of national income to be split among the other 90% of the population, which includes Eugene?
So, what do you think our noble can do with his share of the $0.28? Not much, I suspect which was Vautrin's Message. To earn income from capital, you have to have what ... wealth, of course, and Eugene has none. How do you acquire wealth other than marrying into it or through gift or inheritance? You work your butt off and save like crazy for your retirement. So, the question is, is it reasonable to expect Eugene to be able to save enough wealth from his share of the $0.28, while keeping in mind his profession will be at the top end of that low income bracket supplement his wage income enough to live a good life?
Mean vs Median Wages
NOW, TO FIGURE THAT QUESTION OUT, I AM going to use the current results from another hub I wrote which contains a survey asking what hubbers thought the minimum income that is needed to barely make ends meet in middle America for a family of three. At the moment, it stands between $33,000 and $39,000, depending on whether you take a guess at the overall number or at each major expenditure a family makes (which leads to the higher number.) For comparison, the official federal poverty level is for a family of three is a little over $19,000, around 1/2 of what hubbers think the minimum is that one needs to just survive in today's world; I find that astounding.
Using that data and the information from the previous tables, I construction the wage distribution charts below.
UTOPIA vs REAL WORLD WAGE DISTRIBUTIONS
Click thumbnail to view full-size
 WHERE THE MECHANICS OF BUSINESS GUARANTEE SOME DEGREE OF WAGE INEQUALITY.")
 WHERE DIFFERENT MECHANICS OF BUSINESS GUARANTEE A LARGER DEGREE OF WAGE INEQUALITY.")


 WHERE THE MECHANICS OF BUSINESS GUARANTEE SOME DEGREE OF WAGE INEQUALITY.")
 WHERE DIFFERENT MECHANICS OF BUSINESS GUARANTEE A LARGER DEGREE OF WAGE INEQUALITY.")


Wage Inequality
LET ME DIVERT A MOMENT AND EXPLAIN THE FOUR CHARTS above. Their purpose is to give a picture (you know, the 1000-word kind) of what wage inequality looks like and then associate that with poverty levels. This way we can fit Eugene into the picture to see what his chances are to reach the good life from wages alone.
As I said earlier, this isn't the hub to discuss wage inequality in detail, other hubs have presented several sides of it and a future hub will dig deeply into the subject. Nevertheless, let me start by asking what do you think of when you think of wage equality? Is it everybody earning the same wage? Or, everybody earning a wage that reflects their skill and utility to the company? I don't know for sure, but my guess is it is the latter scenario. But what would that look like if you graphed all those wages out? My initial guess would be people would think the wages would follow a distribution like a persons height does ... a few very short people, a few very tall people, but most people distributed equally around some average height, or in our case wage. That is what Chart 1 depicts.
I set it up to look like a "normal" distribution where half the wages fall on one side of the average wage and the rest on the other side. The numbers on the left axis is how many people have the wage contained in the intervals going along the bottom axis. For example, In my made-up world there are only 1000 people and around 350 of them earn between $38,000 and $46,000 per year . If you add the heights of each bar, they will equal 1000.
So if a "fair" wage distribution is one where the most people earn near the average of all wages and it declines more or less equally on either side of the average, then Chart 1 is what it would look like. Notice that the "median" wage, the wage where 50% of the people each less and the other 50% earn more, is the same as the average. That will become important shortly. Also note the Top 1% bar is in this kind of distribution; it is, as one would expect, very small.
Chart 2, shows the distribution as it really is was in 1960 using 1960 distribution percentages from Piketty and data from the 1960 Census. Notice that while I kept our population at 1000 people, I changed the income brackets to reflect even buckets of income up to the top 1%, then one bucket to capture anything above that the latter bracket is for people earning more than $180,000 per year.
Chart 3, shows the distribution as it really is in 2010, using 2010 distribution percentages and data from the 2010 Census. I also kept the axis the same as in Chart 2.
There is quite a change from Chart 2 to Chart 3, isn't there? It is a tremendous indictment on the deterioration of wage inequality in America over the last 50 years. The actual distribution is skewed heavily to the left and the median wage is quite different than the average wage for 2010, yet in 1960, the curve looks more "normal" like and the median wage is actually to the right of the mean, indicating a relatively egalitarian distribution (the more to the median is to the left of the mean, the more inegalitarian the wage distribution is.).
Also, the top end of the salary range extends very far to the right. But, it is this way because in any economy which lets business set its own wages and organize itself as it sees fit, e.g., not a socialist or communist economy, a normally distributed set of wages is impossible to achieve, in fact some degree of wage inequality is guaranteed, it is just a matter of how much. The reason is as follows. Almost all businesses are organized such that those who actually produce a product or provide a service are the most numerous and the lowest paid. Above them are a lesser number of higher paid supervisors, above them are fewer still higher paid managers, and so on.
The mathematics of a hierarchical pay structure is what forces some degree of inequality. The inescapable truth is higher pay will go to fewer people which is, by definition, wage inequality; you can't get away from it, nor should you ... for all sorts of good reasons. It is when this inequality goes too far, i.e, the rich have gotten too rich and the poor too poor as it has in our moneyless nobleman's case, does it rise to the level of social concern. When it gets to the point where the vast majority of a nations citizens barely survive on the wages they are paid, while, at the same time, a very small minority live a very good life, does social instability arise. This was the case in 1700s and 1800s. This is the case in Chart 4.
The purpose of Chart 4 is to portray the world as it was in the time of Vautrin and Eugene, using dollars that you will recognize. I also added, just for fun, a working population that approximates France's at the time. Consider how far this graph is skewed to the left. It is so skewed that 90% of wage earners earn less than the mean wage of $42,000.
Now look at Chart 5 where I overlayed current poverty levels. As you can tell, much of the population lives below the federally designated poverty level of around $19,000. Almost all of the population falls below what Hubbers think the poverty level ought to be between $32K and $38K. Then, if you look to the right, you will find a bump at the end representing the unbelievably wealthy earning more than 17 times the mean wage (actually, as I will describe a bit later, this translates into 170 times in Vautrin's day)..
Back To Eugene Rastignac
FOR REASONS I WON'T GET INTO, CHART 5 actually presents a rosier picture for Eugene than the one he truly faced in the mid-1800s. That is because I chose to use modern wage rates, rather than those prevailing at the time, in order to make things more relevant for you. I hope, however, not too much is lost in the translation.
In Chart 6, I laid in two more items, 1) what an average lawyer can make in today's dollars and 2) using Piketty's estimate of how much above the average wage one needs to lead a fairly stress-free life from an economic standpoint. Today that is around six times the average wage and in Eugene's time, that would be about 60 times for the lower end of the range; the difference is the estimated change in purchasing power between now and then.
I am hoping Chart 6 is a stunning to you as it is to me. If you can remember how books like Tale of Two Cities or the recent movie/play Les Miserables described what life was like in England and France in the 17 and 1800s, then that is what that economic life looks like in chart form. Notice how virtually all of the population is scrunched up at the poverty end of the income spectrum which quickly decreases as income increases until you get to the very wealthy where there is a noticeable uptick of beneficiaries. For the period of time we are investigating, the long slope down the chart portrays represents your wage earners. That bump at the end are those who live off of inheritance; they do not have to work. This chart is the essence of Vautrin's message and the choice Eugene must make.
What should jump out at you is that Eugene, given he is in one of the highest paid professions of that, and this time, is well below what it takes to live at a minimally stress-free life. In fact, he is around $110K short, at least in our example. This means, to have any shot at the "good life", not only does he have to be in a very highly paid profession, he must be one of the best in that field as well. In truth, however, he can never attain his wealth goal, for in Rastignac's time, things were even worse than the picture I paint here. And, by the way, I can also lay out a mathematical argument why Eugene can never attain the wealth he desires by labor alone, but I won't. (Under the constraints of Chart 3, in 2010, however, you still can attain your wealth goal, but it is getting harder.)
For Eugene Rastignac, Labor is the Fools (but Moral) Choice
")
So What About Wealth From Capital?
THAT ISN'T GOING TO HAPPEN EITHER, UNLESS YOU INHERITED IT! (To be clear, throughout history, roughly 10 - 20% of your super rich become that way through entrepreneurship, as opposed to labor or inheritance, but this isn't one of Eugene's choices.)
A look at Table 3 should convince you Eugene is out of luck on this front as well. As you can see, 90% of all capital is owned by just 10% of the population, and our penniless nobleman isn't really one of them. Do know, however, that in the story, his family does have an estate, they are nobles after all; but the "rent" they receive from this capital is barely enough to keep Eugene and others in the Rastignac family with room, board, and with some left over for an education (therefore, it is problematic that his family is either given they can't pass on a sustainable inheritance to their offspring); which nevertheless is far in excess of what is available to the vast majority of the French population. What you see missing is any ability for Eugene to save or invest. Further, after Eugene finishes his job and becomes a lawyer or joins the government legal system, he must be able to maintain himself and any family he may acquire; meaning there is little chance to save here either given he is still near the poverty level. It is only after he is well along in his career might he be able to acquire wealth from which to earn capital income to supplement his wages.
But what would Rastignac need to, say, double his income to the minimum he would need? Well, the going return on investment of someone of his means is around 5%, so to make $174,000/yr, he would need a corpus of around $3.5 million. Unless you are extremely lucky, that is virtually an impossible goal, wouldn't you think?
So, the bottom line for Eugene is to tell Vautrin he accepts his offer to kill the Victorine's brother in return for part of the inheritance after he marries her ... IF he wants wealth. Fortunately, Eugene's conscience got the better of him and he chose to live a mediocre life.
Rehearsal
OK, NOW THAT YOUR MIND IS NUMB WITH ALL of those numbers thrown around every which way, we see that Eugene de Rastignac is faced with a dilemma, 1) work a job you have been longing to do and hope it will provide you a very nice life or 2) take the easy way out and have Victorine's brother killed in order to marry into great wealth. So, what does Eugene need to consider, beyond the obvious moral choice?
If our hero is of normal talent, we know that on average he might earn, in our example, a wage of $174,000 by the middle or end of his career.. With that income, Eugene will probably have risen to probably top 5% of those drawing a wage, which in those days would be mediocre, but today would be considered nice. Nevertheless, this is not bad at all, in and of itself.. But because, as we saw, during his lifetime he will earn little or no income from capital assets, his total income from capital will be in the bottom 10% and, in fact, lower his overall income standing slightly. So, Eugene will end up better off then most, but not necessarily in a position where he isn't struggling to keep his head above water in times of trouble in his day. But in today's American society, more than likely he qualifies for upper-middle class, no big whoop, but comfortable; the difference is the level of income inequality?
But what if Eugene is a really, really good lawyer and earns three times the average, or $519,000/yr; then, he has a chance of making the big bucks ... barely. Without going through all of the number crunching, even that amount of wages does not qualify for the top 1% of wage earners, but maybe the top 2 - 3%. Further, because even with $519,000 a year income, it is nearly impossible for Eugene to rise to the top 10% of capital owners. Maybe at the end of his career, Eugene will have accumulated enough wealth to draw a nice retirement, but will he be able to quit work and still maintain the lifestyle to which he has become accustomed, probably not. Nevertheless, at say $ 600,000, assuming some capital income, while he is working, Eugene will be nicely ensconced in the overall 10% percentile.range. But, look what he has to be to obtain that level ... exceptional, well above the norm.
And, by definition, only a few people are exceptional. The conclusion from all of this then is, with the kind of inegalitarian distribution of wage income and capital ownership which existed prior to 1913 (and really between the end of WW I and 1929), the only real expectation an average citizen had of improving themselves was to the middle class, and then only if they were lucky and possessed skills that were in high demand. Otherwise you were relegated to subsistence living.
UP TO THIS POINT, we have been using assumptions from Chart 5. If, however, we use inequality percentages from say 1960 (Chart 2), how might it look for Eugene? Much, much brighter, as a matter of fact. His $174,000 salary now puts him in the top 2 - 3% of wage earners (in our example). Also, the likelihood that he has acquired capital (such as stocks and bonds) from which to earn income has risen substantially. Is it enough to where he might be knocking at the very well-to-do's door? Probably not. BUT, if he is only somewhat more talented and can earn maybe $348,000/year, then he has made the top 1% over all, including income from capital; and in 1960, that is starting to push the 0.5% threshold of the extremely wealthy.. Again, what is making the difference is the degree of wage and wealth inequality.
The Tree of Wealth

That Was Then, What About Now?
WELL, ACCORDING TO THOMAS PIKETTY (and I believe him) ALL SIGNS ARE POINTING TOWARD THE US, and maybe the rest of the rich nations heading back to a facsimile of pre-1913 economic conditions again. Just flip through Charts 6, 2, and 3, in that order to see what I mean. Why Chart 6 became Chart 2, is that the two world wars and the Great Depression knocked the stuffings out of capital ownership inequality while at the same it also reduced the inequality in wage income to reasonable levels. But since the end of WW II, and especially since 1980, with the end of high marginal tax rates and the race to the bottom in taxes on capital gains, dividends, and inheritance in the US and abroad, the disparities, the divergance in both capital (which is already back to 1913 levels, but with a twist) and wages came roaring back; primarily in America and to a lesser degree in England, but not so much in Europe, but hardly at all in Scandinavia..And the march hasn't stopped!
Will we ever see a repeat of Vautrin and Eugene's time? Piketty doesn't think so, but he doesn't rule it out either. The reason he thinks it is unlikely is that with the shocks between 1913 and 1945, there was a fundamental change in the capital structural and in the 1980s, there was the creation of the "super manager"; top executives who get paid astronomical salaries. This means some wage earners can reach the super wealthy status through labor alone and not have to rely on income from inheritance or other capital resources. Further, the social engineering efforts coming out of WW II created an honest-to-goodness middle class in America made up of blue collar and lower paid white collar labor. Later, after the benefits from that effort had been diminished over time by a return to conservatism, a class of highly paid managers developed to replace them as their median income declined. Now, as one can see in Table 6, even this newly minted middle class are having their position eroded as we slowly approach Table 2 again.
In addition, Thomas Piketty has found that beginning in 1990, the role of inheritance, who many had thought had all but disappeared, has made a major comeback. So much so that inheritance plays the same or even more of a role than it did 200 years ago, see Table 4.
You don't yet have to make the choice that Eugene did so many years ago, even though inheritance has regained its former status in most ways save inequality. Because, at least so far, a relatively large, but shrinking number of people can still, through labor alone, work their way into the life of an aristocrat of old. But, Piketty maintains that the course the world is on, if nothing is done, will lead once again to where it is the few that have and the hordes that have not with an unbridgeable gap in between.
Now let's look at inheritance directly and see why it is such a bogeyman, starting with Table 4.
The Different Faces of Inheritance
1810
| 1920
| 2010
| |
|---|---|---|---|
INHERITANCE vs LIFETIME INCOME of BOTTOM 50%
| 10%
| 2.2%
| 13%
|
INHERITANCE vs TOTAL RESOURCES AT AGE 50
| 25%
| 9%
| 23%
|
INHERITANCE vs HOUSEHOLD INCOME
| 21%
| 9% (5% in 1950)
| 20%
|
TABLE 4
The first row reflects, for persons born in that year, what percent of lifetime income of the bottom 50% of wage earners is total inheritance received by those born in that same year. For example, for those born in 1810 and were receiving an inheritance, the total inheritance received by those individuals would be greater than 10% of the lifetime income that earned by the bottom 50% of wage earners born in 1810. For 2010, that rate is 13% and growing.
For the second row, the same procedure is used except the denominator is total wealth (resources) of those receiving inheritance. For example, in 1810, inheritance accounted for 25% to total wealth, Keep in mind, only the top 10% had inheritances or wealth.
Finally, the third row is what percent did inheritance income represent of total household income. That should be self-explanatory.
As you can see, given this is now 2014, the importance of inheritance has exceeded what it was 200 years ago, even though it doesn't appear that way when viewed from a day-to-day perspective. That is because 1) we are in the era of super managers and 2) we have not yet reached the state of inegalitarianism which existed 200 years ago.
So, What To Do?
THE ANSWER IS WHAT NOBODY WANTS TO HEAR, RAISE/CHANGE TAXES. How taxes are structured have a major impact on the distribution of wealth. Other ways are to change fiscal and labor policies. One of the outcomes of the Great Depression was a world-wide realization that governments not only had "regalian" responsibilities to the nation, e.g., police, courts, foreign affairs, common defense, etc (those which the adherents of "small government" find sufficient), but social responsibilities as well. Social responsibilities would be those associated with general welfare, tranquility, pursuit of happiness, and similar values.
By 1933, most major nations had instituted some sort income and capital tax system, but in both cases rates were extremely low, accounting for about only 8% of National Income. Then, shortly after 1910, they were raised to about 12% of National Income to pay for WW I. But, to pay for things like Social Security and other nascent welfare programs as well as WW II, taxes had to be raised again; this time to around 25% of National Income (except for the UK which reached 30%). For obvious reasons, it was the wealthy who picked up the burden for they were the only ones with money, everybody else, due to the depression, were destitute.
After WW II, Europe and Asia had to rebuild. Further, people and their governments still remembered the world-wide great Depression and the income disparity prior to WW I, so they also supported increased spending on social programs. As a consequence, taxes on both labor, capital, and consumption kept increasing until they reached about 29% in 1950 (38% in the UK). After that, different nations took different paths. Further, the taxes were made progressive, meaning those who earned more were taxed more on the portion that exceeded what most earned. One of the main purposes of progressive taxation was to reduce the inequality induced by simply having more money.
In the 1950s, conservatism slowly began its rise in America and between 1950 and 1970, taxes only rose a few more percentage points before leveling off at 30% on national income, where it remains today. In the UK, the same pattern took place where taxes leveled out at 40%. On the other hand, France and Sweden kept increasing their spending on social programs until about 1980, where their spending leveled out at 50% and 55% of National Income, respectively.
If you look at levels of inequality in each of these countries for both wage and capital, guess what you find? America is the most inegalitarian and Sweden the least. And what is more, all four have economies that are, for the most part, capitalistic ... not socialistic.
But, what is also happening in both America and Europe, which is driving even more inequality, is the tax burden has been shifting to the shrinking middle class (which is one reason it is shrinking); at the higher income levels taxes are actually becoming regressive! This means the very wealthy are paying a far less share of their wealth in taxes than they use to, but since the revenue stream is constant, then those below them are picking up the tab. The reason for this is the taxes on inheritance and other wealth resources (corporate income, dividends and capital gains) have been cut significantly, or eliminated altogether, thereby putting a much higher burden on labor and consumption. Since the majority of the very wealthy's income comes from these sources, their effective tax rate falls on-par with or below that of Joe Sixpack.
A major part of the solution, then, would appear to be to return to a tax structure similar to that which was in place during the 1960s when inequality was tolerable. I don't think it needs to be that draconian however for there was a theory popularized by a guy named Laffer during the Reagan revolution that said there is a tax rate that optimizes tax revenues. If the rate is higher or lower than this, tax revenues fall off. The latest simulations of this theory put the rate somewhere between 40 and 70%. Consequently, I would structure the 1960s tax system to reflect a 50% tax rate and not the higher rate that was actually contained in its structure. Anything less, especially at the low level it is now, will drive massive and growing inequality which will ultimately lead to social unrest; the leading edges of which I think we are seeing today.
RELATED LINKS
- Economics For Beginners: Income Inequality
Income Inequality is one of the most controversial issues around right now. In this article, we take a look at the underlying problem that the experts don't want to talk about. - Why the Rich Should be Taxed More: Flat Taxes, Progr...
Economic justifications for progressive taxation. The rich are not as affected by tax increases as other groups, the rich will always pay more in taxes, and high inequality and low interclass mobility are bad. - American History IV: Do You Know Who You Really Are?...
- The American Dream: Conservative View I: Tax Policy ...
The GINI Index is a good measure of economic inequality in society. It is used with other measures to determine if the Conservative version of the American Dream worked after over 100 years of trying. - American History IV: Founded in Liberalism, Conserva...
Liberals come in two flavors, those who believe gov't has a role to play in helping citizens achieve success and those who believe individuals are totally responsible for their own fate, come what may - The American Dream: The "Occupy Wall Street" Movemen...
The Conservatives have one idea on how the economy ought to work and the Liberals have another. This hub explores the difference and looks at the historical data back to 1945, to see what really happened.
© 2014 Scott Belford