Effective Visual Management
What is visual management?
Visual management is all about making everything within our workplace obvious. We should be able to walk into the area where the work is being done and at a glance see if everything is working as it should. There should be no need to consult copious notes and charts, talk with numerous supervisors and managers who resort to pointing at each other when asked simple questions; we should be able to tell the health of our business at a glance.
Lean manufacturing techniques based on the Toyota Management System all support and require visual management techniques to prevent waste. Management and all involved should not have to waste their time finding out what is happening. If information regarding the state of production, schedule attainment, quality, maintenance, standardized work, etc are not immediately apparent then you can be sure that there is still a lot of work to be done to achieve lean processes.
Many of the lean manufacturing tools require the use of visual management, for instance 5S and TPM are heavily based around making your workplace highly visual.
Visual Management Examples
Below I will give various examples of visual management that you should be able to see within any lean environment based around various aspects of the business.
This information can be used as a simple guide or could be adapted to form a simple audit sheet to judge the health of an organization with regard to lean disciplines.
Visual Planning
Visual Planning Boards
Many companies that I go into use MRP type systems to print out daily planning sheets for each operation that are then used by the supervisors to plan out and allocate the work. Few people in the production areas are aware of what is coming next.
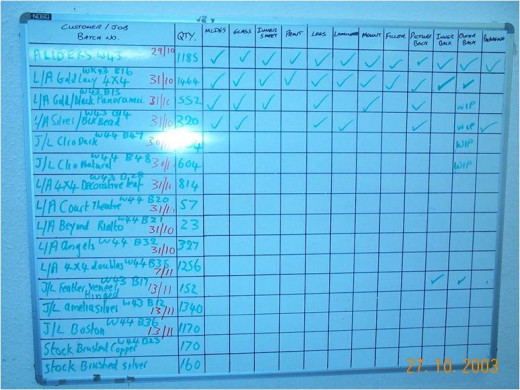
Simple planning boards using t-card systems or even just simple white boards can allow everyone to know exactly what is coming during the day. Combined with daily meetings at the workplace it allows for issues to be raised before they become a real problem.
The board to the right was implemented in a factory in the UK where they were having major issues getting the numbers out each day despite a well organised line. They were launching product down the main production line but then having to change product when they found that components had not been delivered or had not been manufactured internally. All relevant "boxes" on the board have to be ticked before the product is launched down the line. This resulted in a normal weeks production being completed by Tuesday and everyone focusing on solving the other issues. Output was more than doubled just by the use of this planning board highlighting the real issues.
Visual Management Planning
Clear Flow
Visual Management of Production Flow
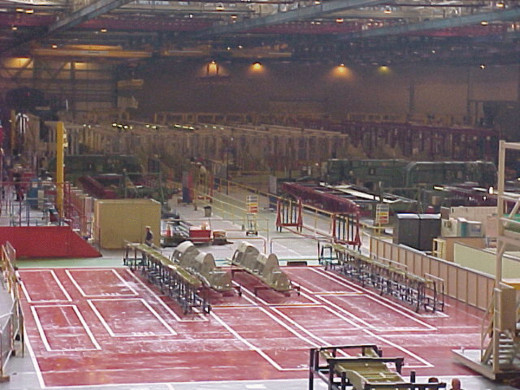
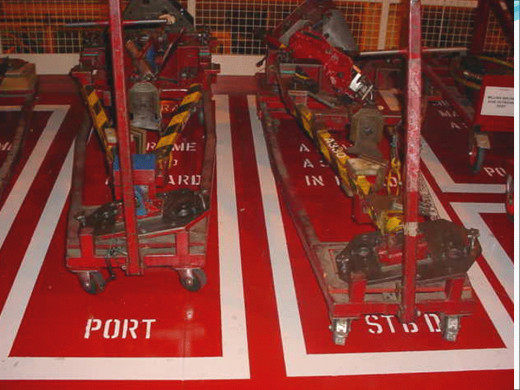
Clear floor markings showing locations for products, clear locations for all components in a work cell; it should be obvious if stock is building up due to overproduction or breakdowns. Components located where there is no identification are clearly in the wrong place and parts overflowing their designated spaces are a clear indication of a problem as are empty spaces.
Kanbans should be obvious and easy to understand in much the same way that floor markings and stock locations above are used.
Schedule requirements and attainment should be displayed within the working area so that it is clear what should be being worked on and if the organization is up to speed.
Simple understandable scheduling boards should be used rather than overcomplicated computer printouts.
Clearly Marked Locations
Shadow Boards
Place for Everything and Everything in its Place
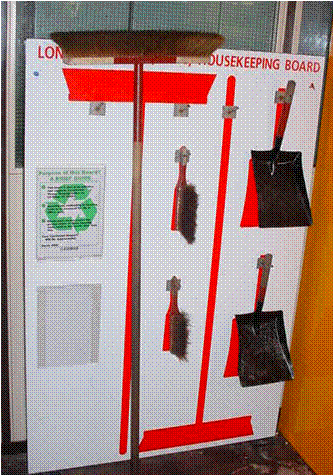
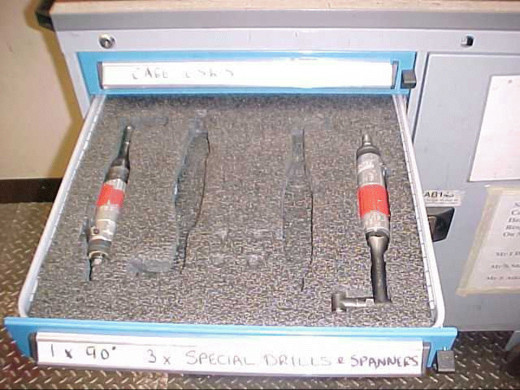
One of the biggest problems that many find within production is trying to find equipment and components either because of poor workplace organization or because the tools have been taken by someone else and not returned.
Implementing 5S gets us to assign a location for all of these tools and products so that it is very obvious if they are missing or out of place. This prevents delays caused by searching for things as well as highlighting issues when they occur.
Many people think of 5S as being a way to improve housekeeping and better organize your workplace; but its main aim is to make problems immediately visible to everyone allowing action to be taken.
Healthcare Visual Management
Problem solving and continuous improvement visual management
Charts showing quality attainment, internal and external defect and rework rates for each cell should be clearly displayed and up to date.
A3 problem solving sheets on display in work / team area or some other form of action planning to show that action is being taken, not just recording data and graphing concerns. It is always worth having a flip chart available in every team area just to record issues and suggestions for improvement.
Visual standards should be available at the workplace, these should be clear and up to date.
Visual Management Communication
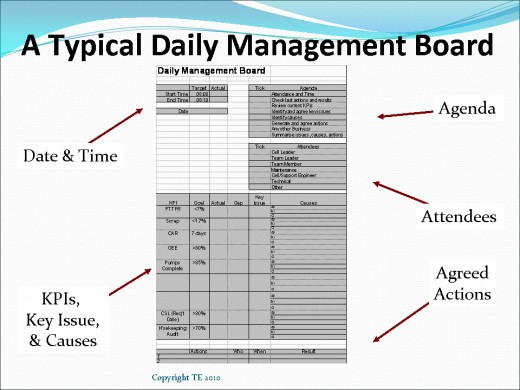
Daily management boards up to date, these are boards that usually show the current output, quality performance and other data recorded by cell leaders on an hourly basis (depending on the industry.) These can give an up to date view of exactly what is happening.
All relevant measures and charts displayed for quality, OEE, performance etc are displayed and up to date within the team area along with actions.
Policies and company goals displayed and understood by the people within the company, it is always worth asking people what the policies are and how what they do fits within those policies and helps the company to achieve their goals.
Up to date company briefings displayed and understood by all, records of attendance for the briefing meeting displayed also.
Visual Management Techniques
5S Visual Management
Visual Management; People
Training boards to show who is trained in what disciplines within the area, Lean manufacturing typically requires the cross training of personnel to enable flexibility in the use of staff. The use of simple I, L, U, O training charts can quickly show skill levels of all employees.
Team boards within each area detailing everyone and their responsibilities.
Color coded shirts/caps/jackets to distinguish worker types within the area so you know who everybody is and what their jobs are.
Story boards showing progress with kaizen or 5S teams to highlight and celebrate team working within the areas.
Awards and certificates to celebrate the successes of the teams and individuals in an area, ensure things like “employee of the month” are all up to date.
Maintenance Visual management
There should be maintenance records for each and every machine or process with clear instructions for conducting the maintenance detailing what, when, who and how.
The use of red tags to highlight outstanding machine problems in need of maintenance attention, where action is outstanding a red tag should be hung either on the machine or on a red tag board in the team area.
Use of transparent guarding on machines to enable visual monitoring of machine performance; letting you see if machines are running smoothly.
OEE Charts with the contributing factors, also a fishbone diagram showing potential causes and an action chart.
Changeover times charted with action chart and clear changeover instructions.
Andon lights to indicate breakdowns and line stops(Toyota also use music, a specific tune for each machine.)
Visual Management Customer Satisfaction
Displays of customer satisfaction measures for the plant as a whole and for individual areas should be displayed and understood by all.
Should cover measures for quality, delivery (on time in full) and possibly also cost.
Andon Boards and Lights
The principle of Jidoka (line stopping when anything out of the ordinary occurs) is supported within Toyota and other companies using lean principles by the use of what are called Andon boards or Andon lights. These highly visible lights are used to tell everyone at a glance the status of a machine or process. They can either be individual lights on each machine or a bank of lights on a central board showing the health of the whole area.
For instance pulling the line stop cord because of reject materials or a the occurrence of a breakdown would trigger the lighting of a red Andon light (often flashing light - with accompanied siren or machine specific tune) which would cause the rapid attendance of the manager / supervisor / engineering team who would be required to quickly and efficiently solve the problem. There would be no filling out maintenance requests to be sent to the maintenance department dungeon in the building next door, if there is a problem everyone required will drop what they are doing to attend and get things running again.
Acting on visual management
It is no good having visual management if people fail to act on what they are being shown. Where possible engineers, supervisors and management should be located in the working area or at the least have to walk through it to reach their office ensuring that they have contact with what is happening.
Many companies have a daily walk around meeting where various members of the management across various disciplines walk from area to area to discuss the performance of each area and allocate resource and responsibilities for any issues affecting daily performance. These daily management meetings should occur every day (shift) without fail at the same time and are an excellent way of ensuring focus on the working environment.
Visual Factory
If you have any questions regarding the application of visual management or lean manufacturing in general then please leave it in the area below.


