ArtsAutosBooksBusinessEducationEntertainmentFamilyFashionFoodGamesGenderHealthHolidaysHomeHubPagesPersonal FinancePetsPoliticsReligionSportsTechnologyTravel

Using graphics and visuals to communicate in a business report

Updated on April 30, 2012

There are four main categories of visuals we use in our professional documents:

1.tables

2.graphs

3.charts

4.illustrations

The uses of graphics have changed greatly over time. It is interesting to think about how graphics were used before the invention of word processing software. If someone wanted a graphic in a document, that person would have to paste it on the sheet and then copy it to make it one page.

The occasions people used graphics were very minimal then. Now putting graphics on a report or memo is easy enough for most anyone to apply. But one major principle remains the same with the new technology we have: keep is simple.

One downfall to having these great software available is that inexperienced people can sometimes go crazy, using way too many visuals until they are no longer effective. One great rule to keep in mind to help simplify things is that a visual should never be used to decorate ; rather, graphics should always pertain directly to the text.

TABLES

The purpose for using a table is to show comparisons in statistics and other information. Tables are organized into rows and columns, separating the provided information. Try to use a table whenever the information being presented is too complex for someone reading it to remember. If you tried comparing the win/loss records of 5 different baseball teams in paragraph form, it may be difficult to understand.
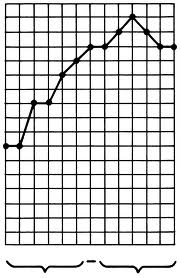
GRAPHS

Graphs are used to show changes and trends for one or more variables. Typically, the two types of graphs used are line graphs and bar graphs.

Line graph- Shows change over time or some other fixed, independent variable, on a ‘xy’ axis grid. One reason you may use a graph is to show an average income over a span of 50 years between two different groups of people.

Bar graphs- Also shows change on a ‘xy’ axis grid, but use bars to represent data, rather than lines. One reason to use a bar over a line graph is when there are multiple independent variables being compared.
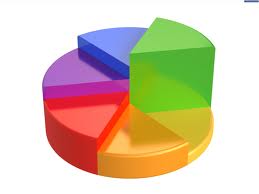
CHARTS

Charts are used to show cause-and-effect and demonstrate relationships between parts of a whole variable.

There are four different types of charts:

1.Flow charts

2.Organizational charts

3.Gantt charts

4.Circle charts/Pie charts

The type of chart you use should be based your audience and purpose. In all, they are a great way to easily show process, order, and sequential information otherwise difficult to comprehend.
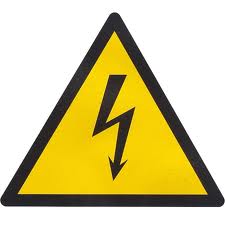
ILLUSTRATIONS

Illustrations can be photographs, drawings or diagrams, and can be a very effective form of visual communication. Our society thrives partly on symbols, or icons, which are a form of illustration. They are sometimes able to say or explain it all without using a single word. Examples include no smoking signs, handicap signs, and other warnings signs.

Using graphics efficiently is essential when writing your professional report documents. Using tables, graphs, charts, and illustrations is a must when trying to communicate effectively with the use of a business report.

working

This website uses cookies

As a user in the EEA, your approval is needed on a few things. To provide a better website experience, hubpages.com uses cookies (and other similar technologies) and may collect, process, and share personal data. Please choose which areas of our service you consent to our doing so.

For more information on managing or withdrawing consents and how we handle data, visit our Privacy Policy at: https://corp.maven.io/privacy-policy

Show Details
Necessary
HubPages Device IDThis is used to identify particular browsers or devices when the access the service, and is used for security reasons.
LoginThis is necessary to sign in to the HubPages Service.
Google RecaptchaThis is used to prevent bots and spam. (Privacy Policy)
AkismetThis is used to detect comment spam. (Privacy Policy)
HubPages Google AnalyticsThis is used to provide data on traffic to our website, all personally identifyable data is anonymized. (Privacy Policy)
HubPages Traffic PixelThis is used to collect data on traffic to articles and other pages on our site. Unless you are signed in to a HubPages account, all personally identifiable information is anonymized.
Amazon Web ServicesThis is a cloud services platform that we used to host our service. (Privacy Policy)
CloudflareThis is a cloud CDN service that we use to efficiently deliver files required for our service to operate such as javascript, cascading style sheets, images, and videos. (Privacy Policy)
Google Hosted LibrariesJavascript software libraries such as jQuery are loaded at endpoints on the googleapis.com or gstatic.com domains, for performance and efficiency reasons. (Privacy Policy)
Features
Google Custom SearchThis is feature allows you to search the site. (Privacy Policy)
Google MapsSome articles have Google Maps embedded in them. (Privacy Policy)
Google ChartsThis is used to display charts and graphs on articles and the author center. (Privacy Policy)
Google AdSense Host APIThis service allows you to sign up for or associate a Google AdSense account with HubPages, so that you can earn money from ads on your articles. No data is shared unless you engage with this feature. (Privacy Policy)
Google YouTubeSome articles have YouTube videos embedded in them. (Privacy Policy)
VimeoSome articles have Vimeo videos embedded in them. (Privacy Policy)
PaypalThis is used for a registered author who enrolls in the HubPages Earnings program and requests to be paid via PayPal. No data is shared with Paypal unless you engage with this feature. (Privacy Policy)
Facebook LoginYou can use this to streamline signing up for, or signing in to your Hubpages account. No data is shared with Facebook unless you engage with this feature. (Privacy Policy)
MavenThis supports the Maven widget and search functionality. (Privacy Policy)
Marketing
Google AdSenseThis is an ad network. (Privacy Policy)
Google DoubleClickGoogle provides ad serving technology and runs an ad network. (Privacy Policy)
Index ExchangeThis is an ad network. (Privacy Policy)
SovrnThis is an ad network. (Privacy Policy)
Facebook AdsThis is an ad network. (Privacy Policy)
Amazon Unified Ad MarketplaceThis is an ad network. (Privacy Policy)
AppNexusThis is an ad network. (Privacy Policy)
OpenxThis is an ad network. (Privacy Policy)
Rubicon ProjectThis is an ad network. (Privacy Policy)
TripleLiftThis is an ad network. (Privacy Policy)
Say MediaWe partner with Say Media to deliver ad campaigns on our sites. (Privacy Policy)
Remarketing PixelsWe may use remarketing pixels from advertising networks such as Google AdWords, Bing Ads, and Facebook in order to advertise the HubPages Service to people that have visited our sites.
Conversion Tracking PixelsWe may use conversion tracking pixels from advertising networks such as Google AdWords, Bing Ads, and Facebook in order to identify when an advertisement has successfully resulted in the desired action, such as signing up for the HubPages Service or publishing an article on the HubPages Service.
Statistics
Author Google AnalyticsThis is used to provide traffic data and reports to the authors of articles on the HubPages Service. (Privacy Policy)
ComscoreComScore is a media measurement and analytics company providing marketing data and analytics to enterprises, media and advertising agencies, and publishers. Non-consent will result in ComScore only processing obfuscated personal data. (Privacy Policy)
Amazon Tracking PixelSome articles display amazon products as part of the Amazon Affiliate program, this pixel provides traffic statistics for those products (Privacy Policy)
ClickscoThis is a data management platform studying reader behavior (Privacy Policy)