Analyzing Adsense Income With Google Analytics Custom Segments

Google Analytics is a wonderful tool that can help you understand the visitors to your pages, what brought them, what they did while they were there and what they did on their way out.
If you are using Adsense. Analytics can provide details that you simply cannot get from the reporting tools that Adsense gives you. This is all good, but I do have to throw a small damper on your enthusiasm.
If you have low traffic, Analytics isn't going to tell you much. That should be obvious, but I seldom see this mentioned when I come across articles waxing on about the wonders of Analytics. Any statistical tool needs to have a sufficient amount of data to analyze - if your traffic is a handful of visitors per day, Analytics simply isn't going to give you much insight. It can't - you don't have enough traffic.
Google only integrated Adsense into Analytics in December of 2008, so even if you have been using it since then as I have, you don't have a very long history to analyze - so though your traffic may be decent, Analytics still can't show you long term indicators.
Worse, the arrival of Adsense in Analytics coincided with a major economic downturn that is still continuing as I write this. If you have good traffic and have been using Analytics since the very first day Adsense tracking was turned on, you have only been tracking data from a period that we hope is extremely abnormal! Any patterns detected may not hold true at all in a more normal environment.
Wait, it gets worse
If all that isn't bad enough, Google Analytics misses some data entirely. They have a page that suggests various errors you could have made that would cause data to be missing, but even if you do everything right, Analytics still misses some clicks.
How can I say that so positively? Because I have seen it in URL Channel reports. That is, I have seen Adsense Channel reports show income for pages that definitely carry Analytics code, but there is no corresponding data in Analytics.
How can this happen? It's probably just that the code didn't fully load for whatever reason. It's possible that the visitor clicked on the ad before the page finished loading or before the Analytics code could get its bearings. The pages just don't get counted in Analytics. I once had a day where fully half the Adsense income was missing from Analytics!
I find that it is not at all unusual for 20% of my Adsense earnings to be unreported in Analytics. It would not be fair to extrapolate from that and say that it misses 20% of all pages, because a click is an event that causes the visitor to leave your page, but obviously SOME pages are missed, so we can add that to the other reasons why Analytics is giving us less than we might desire.
For the techies: I once thought that the 20% miss rate might have been because I had a lot of dynamic content - perhaps that was slowing down page load too much. However, some time ago I switched to static pages with the "dynamic" content regenerated as needed. This of course improved page load times (which is the reason I did it) but Analytics continues to miss pages.
Disclaimer
Google is famously paranoid about advertisers disclosing anything more than gross revenue from Adsense. They do not like us talking about click through rates or income per click. This is certainly because some publishers get better deals than others and Google doesn't want us comparing our rates to other sites. I'm quite sure that HubPages gets a better deal than I do at my main website and I probably get better treatment than some little guy with twenty visitors a day, but we can't compare any of that directly.
Therefor: Any and all information in this Hub that indicates click-through-rates, page views and income is completely fictional. I've created figures strictly to demonstrate the sort of information analysis you can get from Google Analytics. The data is not real. It's made up.
When I show screenshots, I have blacked out or cropped out things that could upset the nice folks at Google. I apologize for that, but it's not worth risking my account just to give you information that wouldn't be particularly useful to you anyway unless you could see the same data for dozens of other people.
Finally, the site we are looking at in those shots is a tech site, and tech sites are different than other sites in many ways. For one, the visitors tend to be more sophisticated and knowledgeable, so are less likely to click on ads. However, many of the ads displayed are of higher value.


Where does the income come from?
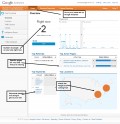
With all that preamble out of the way, let's dive in and see who is clicking on what. You'll probably jump in and look at the Adsense Overview first. The picture to the right is mine for July 2010.
The first thing to notice is that the dollar amount is wrong. If I ask Adsense about July, I get a different result. - almost $200 difference That's a lot of lost data, but it may just be normal for this sort of site. Most search visitors are looking for something very specific - if they don't find it, they know that at a glance and if the ad happens to look promising, they may be clicking at that before the page fully loads. Or the Analytics server may just be overloaded - I don't know what causes these misses, I only know they do happen.
Still, we have a good amount of traffic to gain some insights.


It's Search that Matters
If we go up and look at traffic sources, we can drill into the Search figures and see what part of Adsense income came from those visitors.
It's is almost 90% from search.
That does NOT mean that regular visitors aren't important. The next two pictures show that returning visitors account for 16% of overall visits and better than 8% of Adsense revenues.
There's potential overlap here. Nothing says that a returning visitor did not return by way of Search! At a tech site, that wouldn't be unexpected at all.
However, returning visitors are more likely to have seen the ads before, so that may cause them to be less interested. They may also be "ad blind" - they know where you run ads, they are accustomed to where the real content is, so they can easily ignore the ads.
But what are returning visitors? A visitor that came twice is much different from someone who has visited daily. The latter is much more likely to be ad blind and we'd expect them not to click on ads.
Let's see what we can find out from Analytics.

What can Analytics tell us?
We have about 39,000 returning visitors, but a little more than half of those only came twice. The biggest bulge in the data is in the 8-50 visits slots; those are more likely to be "regulars".
Can we tell how much they contribute to our income? Yes, we can, but we need to define custom segments to get that information.
Custom Segments
Custom segments are probably the most useful part of Analytics, because they let us answer this type of question. Google has a help page that introduces you to how to create these custom segments but for now just understand that these allow us to filter data.
For example, I created two custom segments for customer loyalty - one for those who had visited 5 times or less and one for those who had visited more than five times.


Too advanced for you?
I know that for some of you, this is very advanced stuff and may be a bit scary. On the other hand, you may feel that you are losing out on important information that could help you do better.
Please remember what I said in the beginning: if you only started using Analytics recently, or if you do not have a large amount of traffic, Analytics really can't tell you much of value anyway. The combination of new to Analytics and low traffic is almost always going to be true for newbies, so you really should not be fretting over this just yet.
I think you definitely SHOULD turn on Analytics.
If you want to use Analytics at another site, see Google for help on that.
If you are getting at least a trickle of Adsense income, you will immediately notice some interesting things that channel data cannot show you. Often, channel data distorts reality. For example, you may have a "Main Ad" channel that shows 30 clicks and $24.00 in income for today. From that, you might assume that each click was worth 80 cents, but when you look at Analytics, you may find that one click was worth $10.00 and the other 29 were all low paying. That is not terribly unusual.
At this point, you may not care about custom segments because you will need more data and a longer period to have them show anything useful. However, that's why you want to turn on Analytics NOW - the earlier you start, the more data you will have when you are ready to start digging below the surface.
If you are in that "newbie" class, bookmark this page and come back to it when you have a bit more traffic under your belt and have played around with the basic Analytics reports. You may find this page is much more interesting six months from now!
A look inside
These show the picture very clearly. Visitors returning five or less times account for most of the revenue. Those between five and twenty account for almost all of the rest. When we reach those who have returned twenty times or more (the obvious "regulars"), revenue drops to 4 cents!
I knew that prior to Analytics - I created a custom ad channel that I used on the 30 newest pages, and removed it from the oldest as I added new content. Regulars naturally are going to read new content mostly, not pages they have already seen. The ad revenue for that "newly posted" channel was always insignificant.
Search is what matters here. If you have enough data, you can find out if the same is true for your pages - it probably is.
You can create custom segments for almost anything you want to analyze. Once you have done a few simple cases, your imagination and curiosity is all that limits you.
If you are going to make good use of Analytics, you need to master custom segments.
Related

Google Analytics Real Live Beta: See Your Stats Before Your Eyes!

Is It Possible to Earn 1000 Dollars in a Month Online With Adsense?
My First Hubpages Pay-Out. Plus, How To Increase Your Views From Google

AdSense, Lead Generation, and Affiliate Marketing are the Three Best Ways To Make Money Online

Seth Godin's Failed Squidoo Site Sells Out to HubPages