Do HubScores Accurately Predict Earnings?

In the HubPages community, HubScores represent the quality of individual hubs. Are HubScores also good predictors of the earnings you can expect to receive from your hubs? An easy-to-use statistical tool indicates my HubScores have only a very weak correlation with my earnings. The takeaway? From my limited data from 30 hubs, HubScores are an entertaining way to get feedback on the quality of my hubs, but they aren’t worth worrying about when it comes to the HubPages earnings program.
What are HubScores?
HubScores are used to represent the quality of individual hubs. HubScores range between 1 (the lowest score) and 100 (the top score). According to HubPages’ Frequently Asked Questions (FAQs), HubScores depend on a number of factors, with the most important including the amount of traffic, the reputation of the Hubber, the response of readers to the Hub, and the uniqueness of the Hub’s content. The FAQ caution that, since HubScores change frequently over time as new data comes in and “fluctuate quite a bit, seemingly at random”, Hubbers should avoid getting too hung up on their Hubs’ HubScores. That said, HubScores are still a useful and fun way to get feedback on the quality of the hubs that you write.
Most of my 30 published hubs received an initial HubScore in the upper 40s or lower 50s immediately upon publication. My HubScores have then trended upward over a period of a few weeks, until they’ve reached plateaus in the mid 70s to mid 80s (with a few reaching upward into the 90s). At that point, my HubScores have continued to move up and down, seemingly at random (just as the FAQ cautioned!). It’s been entertaining to follow the progress of my HubScores, and they are a fun feedback mechanism to gauge the quality of my hubs even though I often scratch my head at the reasons for their movements.
Lately, I’ve noticed that several of my hubs with lower HubScores are getting the most page views, while several of my hubs with higher HubScores are getting fewer page views. This makes me wonder: Is a high HubScore a good predictor that a particular hub will get many page views and have high earnings, while a low HubScore will predict that a particular hub will get fewer page views and have low earnings? This seems like a reasonable hypothesis, as one would expect more people to view a higher quality hub than a lower quality hub. It also seems like a reasonable hypothesis since, according to HubPages’ FAQ, one of the most important factors in determining a HubScore is the amount of traffic for the hub.
To determine the relationship between HubScores and earnings, I’ve assumed that earnings are directly related to page views. In other words, more page views lead to more earnings. Then, I used an easy-to-use statistical tool called the Pearson Correlation to calculate the correlation between the HubScores for each of my 30 published hubs and the number of page views for those published hubs over the last 30 days (I used page views over the last 30 days to avoid giving my older hubs an unfair advantage).
What is the Pearson Correlation?
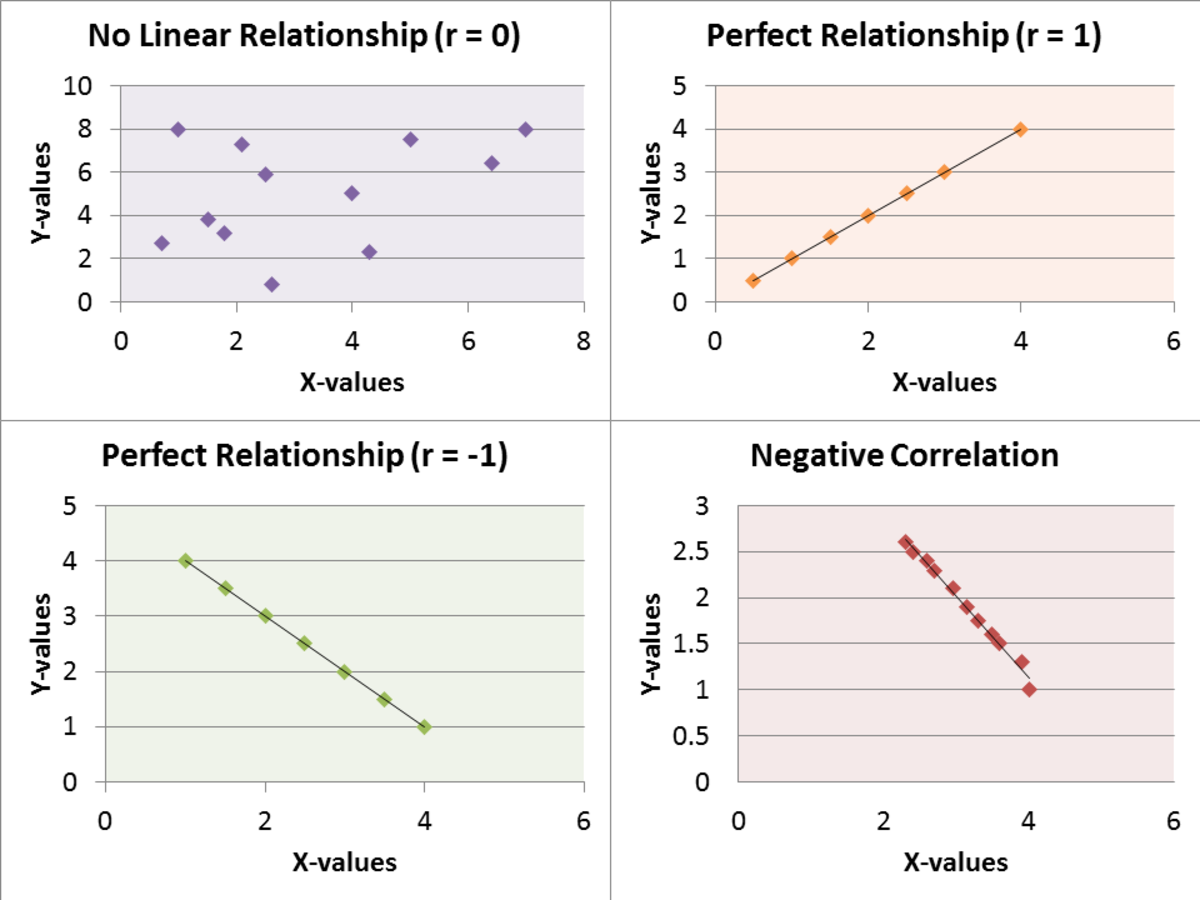
The Pearson correlation coefficient r is a calculation of the correlation between two variables X and Y. For the purposes of this article, it is sufficient to understand that this calculation outputs a correlation coefficient r ranging between +1 and -1, inclusive. A correlation coefficient of +1 indicates Y increases as X increases. An output of 0 indicates there is no linear correlation between X and Y. An output of -1 indicates Y decreases as X increases.
The interpretation of positive correlation coefficients between 0 and + 1 is described in the following table. This same interpretation also applies to negative correlation coefficients between – 1 and 0.
Interpretation of Correlation Coefficients
Correlation Coefficient
| Interpretation
| |
|---|---|---|
0.00 - 0.19
| Slight, almost negligible correlation
| |
0.20 - 0.39
| Low, small correlation
| |
0.40 - 0.69
| Moderate correlation
| |
0.70 - 0.89
| High correlation
| |
0.90 - 1.00
| Very high correlation
|
A number of Internet sites make it very easy to calculate the Pearson correlation coefficient for two variables. For example, http://www.easycalculation.com/statistics/correlation.php provides an easy-to-use correlation coefficient calculator. Simply enter as many X values and Y values as you’d like, and then click on the “Calculate” button. The calculator then automatically calculates the correlation coefficient.
As an example of applying the Pearson correlation to HubScores and page views, assume a Hubber has published three hubs. The first hub has a HubScore of 60 and has received 25 page views over the last 30 days. The second hub has a HubScore of 70 and has received 30 page views, and the third hub has a HubScore of 80 and has received 35 page views. In this example, the X value is the HubScore and the Y value is the number of page views over the last 30 days. To calculate the correlation coefficient, enter these three pairs of X and Y values into the online calculator: (60, 25); (70, 30); and (80, 35). Then, click on “Calculate”. The result of the calculation is a Pearson correlation coefficient of + 1, which indicates that the number of page views (Y) increases as the HubScore (X) increases. If the HubScore was a perfect predictor of the number of page views (and, hence, earnings), this is what one would expect.
Pearson Correlation Coefficient for My 30 Published Hubs
For my 30 published hubs, the HubScores and page views over the last 30 days are as follows: (70, 8); (73, 26); (75, 302); (76; 37); (77, 17); (77, 23); (79, 29); (79, 23); (79, 22); (79, 24); (80, 32); (80, 30); (80, 117); (80, 14); (81, 38); (81, 59); (81, 13); (81, 33); (82, 14); (82, 18); (83, 36); (83, 71); (83, 10); (84, 13); (85, 21); (86, 49); (87, 56); (90, 42); (93, 127); (98, 98). After I entered these 30 data pairs into the online coefficient calculator and clicked on “Calculate”, the tool returned a correlation coefficient of + 0.113.
The fact that the Pearson correlation coefficient for my 30 published hubs is positive indicates there is a positive linear correlation between the HubScores and the page views for my 30 published hubs. On the other hand, the fact that this coefficient of + 0.113 is much less than + 1 indicates this correlation is very weak. Indeed, according to the interpretation chart above, this coefficient of + 0.113 indicates a “slight, almost negligible correlation”. Considering that the amount of traffic to a hub is one of the important factors in determining the HubScore, this correlation coefficient of + 0.113 seems surprisingly small.
Conclusion
Since there is only a “slight, almost negligible correlation” between the HubScores and page views for my 30 published hubs, I will follow HubPages’ advice and avoid getting too hung up on my HubScores. I will continue to follow my HubScores as they are an entertaining way to get feedback on the quality of my hubs. But when it comes to predicting earnings from the HubPages earnings program, I’ll simply ignore them.


