6.5 Mag Quake Falls within Predicted Window

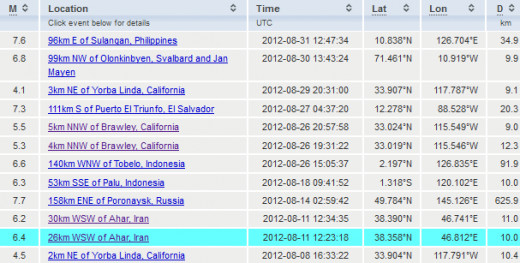
 for August 2012. The blue highlighted quake fell within the predicted window (the source below gives it as a 6.5 magnitude quake).")
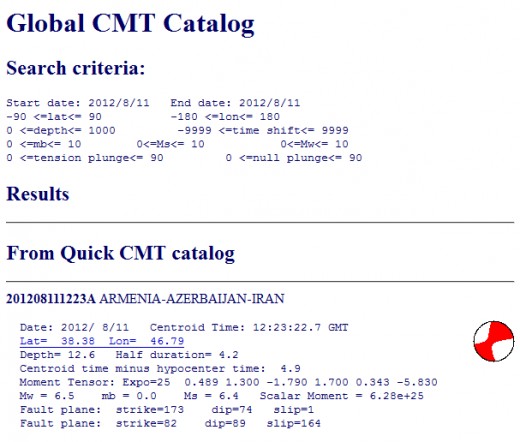
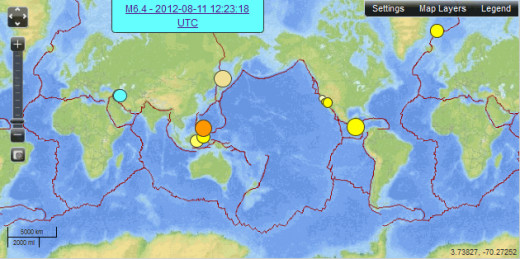
When I first published this hub on August 22nd, it looked like it would turn out to be a slow month, but things heated up after that. Before that period there were just two significant events in the mid 6 magnitude range or higher. There was a 7.7 magnitude earthquake off the coast of Russia, not too far from Japan, but only its size made it a significant event (it was located so deep within the earth that it did not cause significant damage or produce any casualties). The other event left a much more destructive mark. On August 11th, there was a shallow quake reported as either a 6.4 or 6.5 magnitude event which produced a 6.2 or 6.3 magnitude aftershock shortly thereafter. Although its size wasn't as significant, it caused the death of over 300 Iranians.
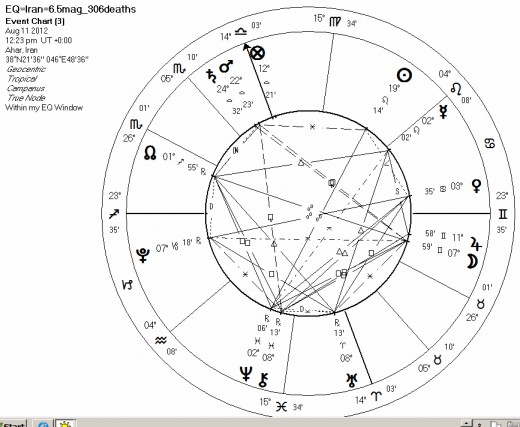
What makes this quake even more interesting was the fact that it fell within the only earthquake window that I defined for that month as likely to produce an earthquake of 6.5 or greater. The location of the quake was not correctly predicted but that is likely at least 4 times harder to pin down than successfully predicting a time of occurrence.
Just before this month I had lowered the bar from 6.7 to 6.5 as the lowest magnitude event to expect within my defined window. That effectively increased the chances that a quake will fall within a proposed window since there are normally 2 or 3 quakes of 6.7 or greater per month and about 4 per month for 6.5 or greater quakes. In the future I plan to lower the lowest magnitude of predicted significant events to 6.4 (this would double the chances of a quake occurring within one of my windows or the likelihood of 5 quakes of 6.4 occurring per month instead of half as many for 6.7 or greater quakes). I should point out that by lowering the magnitude threshold, it doesn't necessarily increase the significance of my results (there will be more quakes falling outside of the windows as well as inside of the windows).
One of the reasons why I wish to include lower magnitude quakes is because of an official decision related to how earthquakes would be recorded from 1990 forward at data centers responsible for calculating and recording seismological events. From that year on, the official method of determining the size of an earthquake became the Moment Magnitude scale or Mw. That method of measure was created to more accurately determine the strength of quakes above 7.7 on the older Surface Wave magnitude scale or Ms.
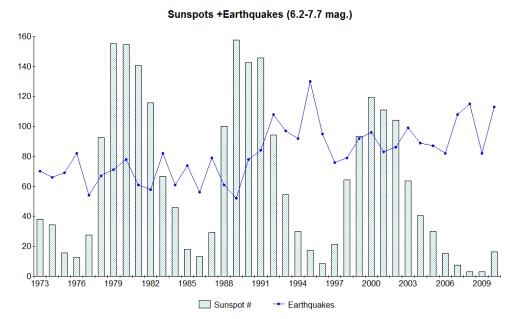
Apparently, for reasons of uniformity, it was decided to start recording all new events as low as 4.9 magnitude using the newer method. However, even though it can be shown that Ms and Mw magnitudes average out about the same down to about 6.2 magnitude, the difference between the two scales is often 0.1 to 0.3 of a magnitude at variance, especially in the mid 6 range. As an example, USGS/NEIC had 6.7 Ms as the tentative value of the 8/11/12 Iranian quake for a few days before they settled on 6.4Mw as the official figure. Below 6.2 magnitude quakes measured using the Surface Wave method (Ms) become significantly higher when converted to the Moment Magnitude (Mw) scale. Notice how the series of earthquakes per year in the 6.2-7.7 magnitude range increases noticeably in the 1990-2010 period when compared to the earlier period (see chart below).
Since, after researching the subject, I have concluded that such differences are common, I have chosen to make my predictions specifically address events of 6.4 magnitude (Mw) or higher. This is mostly due to my belief that many earthquakes determined to be 6.4 magnitude in size could be argued to be higher, perhaps as high as 6.7 when the events are not recorded by detectors within a few hundred miles of the epicenter. In a normal month one would expect 4 quakes of 6.5 or greater. As it turned out (if one counts the Iranian quake as being one of 6.5 magnitude) there were 6 quakes ranging from 6.5 to 7.7 falling within the last 2/3rds of the month. That is 50% more than usual and the Iranian quake falling within my only window for the month amounted to 1.3Xs more than the expected likelihood.
Another interesting seismic event of note was what occurred in southern California on August 8th, 2012. On that date there were two 4.5 magnitude events separated by about ten hours. There was also a 4.5 magnitude temblor in Coalinga two days before this. This reminded me of a 5.4 magnitude shock that I felt in San Francisco at 1:15am, PDT on August 8, 1989. It originated about 60 miles south of there, in the Loma Prieta area of the Santa Cruz Mountains. Ten weeks later occurred the 6.9 magnitude quake in the same location, causing much death and destruction in the San Francisco bay area.
Because of this recent series of events, and also my belief that seismic activity should increase over the next four months, as well as the fact that southern California is often on my list of potential locations of at least one event of 5.4 magnitude or higher during that period, I would prepare myself for such a possibility if I lived in that area.

My seismic windows within which there should be an increased chance (related to astrology) of a 6.4 magnitude or greater earthquake (5.4 or larger in the US) occurring for the month of September, 2012, are as follows (the dates in parenthesis are of earlier significant quakes that relate astrologically to the new predicted date in the same epicenter area):
September 5th (0900 UT +-45hrs) Possible location of event= Turkey: Ayvalik, Izmir (October 15, 1883) at 0100 UT on September 5th or Philippines: Mindanao (March 31, 1955 and November 11, 1921) at 0700 UT on September 5th or USA: California: Hayward (October 21, 1868) at 0700 UT on September 5th or USA: Virginia: Giles County (May 31, 1897) at 1000 UT September 5.
September 18th (6pm UT +-78hrs) Possible location of event= Peru: Lima, Callao (October 29, 1746) or Iran: Tabas (September 16, 1978) at 2100 UT on September 17th or USA: California: Santa Barbara (August 13, 1978) or USA: western Nevada: Cedar Mountain (December 21, 1932) at 1600 UT on September 17.
October 1st (6pm UT +-42hrs; begins on September 30th at 0001 UT) Possible locations of event= Venezuela: Cumana (December 14, 1797) at 1500 UT on September 30th or Italy: Avellino, Napoli (December 4, 1456) or Algeria: Oran +Spain: Cartagena (October 9, 1790) at 1730 UT on October 2nd or USA: Colorado: Denver (November 8, 1882) at 2330 UT on October 1st.
If 5 quakes of 6.4 magnitude or higher occur within September 2012 (a typical number based on a statistical average), it would be normal for 2 of those quakes to fall within the above described windows. What I am expecting would be at least 3 such quakes to fall within the windows (or at least 1.6Xs greater than the statistical average).
Copyright © Joseph W. Ritrovato

Update for August 31, 2012
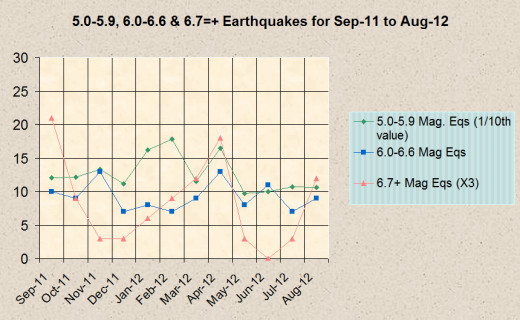
Well, it turns out that the 6.5 magnitude quake that fell within my predicted window for August (most sources give 6.4 but it is debatable) was 1.3Xs more than expected for any 4 day period during a 31 day month with 6 quakes of 6.5 or greater (which is 1.5Xs the usual monthly amount). The first seven months of the year have been average for quakes in the 5.0-5.9, 6.0-6.6, and 6.7 or greater earthquake ranges, but in August, although the first two lower magnitude ranges were average, the 6.7 or greater quakes were 1.6Xs more numerous than average. If one looks at just the three 7.3 and above quakes that occurred in August (which normally happen about twice during a three month period) their frequency was 4Xs the expected average (or 7.6Xs what would be expected in an 18 day period since they were clumped together within that range). I'm expecting this last trend to continue into the next few months of this year, with the three stated ranges of magnitude becoming more like 1.5Xs the average frequency of occurrence.