ArtsAutosBooksBusinessEducationEntertainmentFamilyFashionFoodGamesGenderHealthHolidaysHomeHubPagesPersonal FinancePetsPoliticsReligionSportsTechnologyTravel

A Larger Pool of Data Isn't Necessarily a Better One...

Updated on January 6, 2012
retrojoe profile image

Has studied astrology/historical seismology since the late '70s in San Francisco. Published in the ISAR International Astrologer in 2012.

Statisticians often seek a mountain of data to gain as much credibility as possible for their results. One often hears of medical studies conducted with thousands of people. But the numbers aren't everything. And neither is statistics. Or as that famous phrase goes: "There are three kinds of lies: lies, damned lies, and statistics."

If you understand how to manipulate the data and realize the shortcomings of statistics, you can almost make it say whatever you want to back up your argument. For example, many doomsayers often say that the data shows that earthquakes have been increasing alarmingly over the last century and it is all leading to super huge deadly quakes and we are all doomed to eternal damnation, etc. etc. But, the data they present into their simple minded analysis is as much data as is available, including quakes that aren't even humanly perceptible or quakes that until recently weren't even recorded and preserved. What happens is an artificial inflation of the data over time which makes it appear as though there is an actual increase in activity when in fact it is really only an increase in the detail being observed over time.

Similarly if you want to make a subject appear to have no discernable effect so as to dismiss it, you drown it in a mass of data that is too wide in scope to get a focused result. Many times, if you want to test the credibility of a statistical study, all you have to do is see who paid for the analysis and determine if they had anything to gain or a conflict of interest.

Looking at the subject of UFOs, one can argue that there is an increased presence of aliens since monthly reports have more than tripled in the past fifteen years. Again, like the earthquakes, there are better or more complete data collection methods than before. Also, there may not be enough man power to weed out weak reports from the rest and as the stigma of reporting them goes down, reports go up. The founding researchers in the field of Ufology were aware of the problem, not being able to see any significance in the data since there was too much noise to be able to discern any signal that it might contain. They started labeling reports with a strangeness and credibility rating.

The reports with the highest strangeness and credibility rose to the top so that more time and effort could be assigned them for analysis. The data was like a pyramid with the best sightings at capstone level. That data was also in the minority, comprising no more than 5% of all the information available. If any significance could be found, it would be in that gold mine of data.

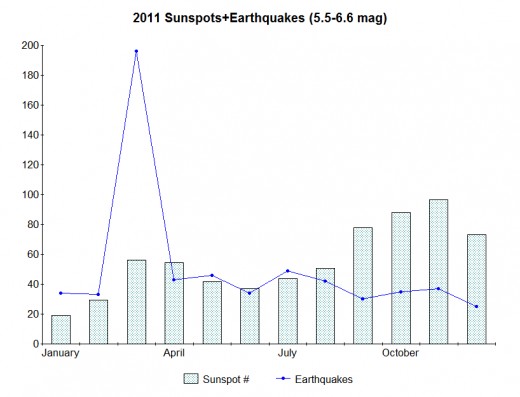
Similarly, if any link of earthquakes to an external trigger or activity that parallels them can be found, one best seeks out the most significant data. Destructive earthquakes that take a large number of human lives are usually no smaller than 6.2 in magnitude, but most are 6.7 or higher. That's why I usually look at data from that level and up, amounting to almost 28 quakes a year on average. If one were to look at earthquakes from the 5.0 magnitude and higher range, one would be dealing with 1,586 quakes annually on average (or 4.5 per day). One would also lose the signal from all the background noise of randomness and to aftershocks of the largest earthquakes. As an example see the monthly breakdown for 2011 of quakes from 5.5 to 6.6 magnitude (shown above). Nothing more significant than a flood of aftershocks to the huge Japanese earthquake and tsunami were responsible for the spike in the month of March.

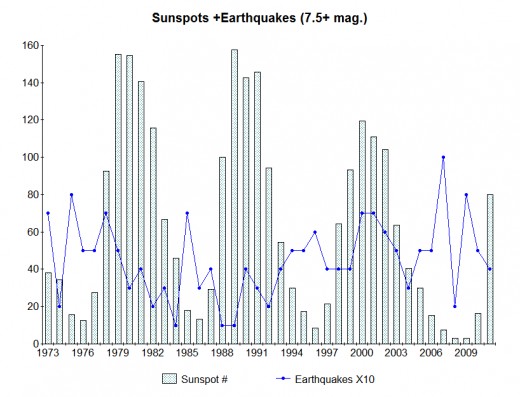
When I look at quakes of 6.7 magnitude or higher I am interpreting 1.75% of the total of all earthquakes from 5.0 or larger. But the greatest significance to a parallel of earthquakes to sunspot numbers occurs when I look at temblors of 7.5 magnitude or higher which translates to only 4.5 earthquakes per year annually (on average) or 0.285% of the 5.0 magnitude or larger data set (see the graphic below).

Here is a breakdown of the number of worldwide earthquakes one can expect annually on average (based on data from USGS/NEIC for the years 1973-2011):

Magnitude Earthquakes per Year

4.5-4.9= 3,072.154
5.0-5.4= 1,169.282
5.5-6.6= 388.692
6.7-7.8= 26.590
7.9-9.9= 1.1795
________________
4.5-9.9 ttl= 4,657.90

© 2012 Joseph Ritrovato

working

This website uses cookies

As a user in the EEA, your approval is needed on a few things. To provide a better website experience, hubpages.com uses cookies (and other similar technologies) and may collect, process, and share personal data. Please choose which areas of our service you consent to our doing so.

For more information on managing or withdrawing consents and how we handle data, visit our Privacy Policy at: https://corp.maven.io/privacy-policy

Show Details
Necessary
HubPages Device IDThis is used to identify particular browsers or devices when the access the service, and is used for security reasons.
LoginThis is necessary to sign in to the HubPages Service.
Google RecaptchaThis is used to prevent bots and spam. (Privacy Policy)
AkismetThis is used to detect comment spam. (Privacy Policy)
HubPages Google AnalyticsThis is used to provide data on traffic to our website, all personally identifyable data is anonymized. (Privacy Policy)
HubPages Traffic PixelThis is used to collect data on traffic to articles and other pages on our site. Unless you are signed in to a HubPages account, all personally identifiable information is anonymized.
Amazon Web ServicesThis is a cloud services platform that we used to host our service. (Privacy Policy)
CloudflareThis is a cloud CDN service that we use to efficiently deliver files required for our service to operate such as javascript, cascading style sheets, images, and videos. (Privacy Policy)
Google Hosted LibrariesJavascript software libraries such as jQuery are loaded at endpoints on the googleapis.com or gstatic.com domains, for performance and efficiency reasons. (Privacy Policy)
Features
Google Custom SearchThis is feature allows you to search the site. (Privacy Policy)
Google MapsSome articles have Google Maps embedded in them. (Privacy Policy)
Google ChartsThis is used to display charts and graphs on articles and the author center. (Privacy Policy)
Google AdSense Host APIThis service allows you to sign up for or associate a Google AdSense account with HubPages, so that you can earn money from ads on your articles. No data is shared unless you engage with this feature. (Privacy Policy)
Google YouTubeSome articles have YouTube videos embedded in them. (Privacy Policy)
VimeoSome articles have Vimeo videos embedded in them. (Privacy Policy)
PaypalThis is used for a registered author who enrolls in the HubPages Earnings program and requests to be paid via PayPal. No data is shared with Paypal unless you engage with this feature. (Privacy Policy)
Facebook LoginYou can use this to streamline signing up for, or signing in to your Hubpages account. No data is shared with Facebook unless you engage with this feature. (Privacy Policy)
MavenThis supports the Maven widget and search functionality. (Privacy Policy)
Marketing
Google AdSenseThis is an ad network. (Privacy Policy)
Google DoubleClickGoogle provides ad serving technology and runs an ad network. (Privacy Policy)
Index ExchangeThis is an ad network. (Privacy Policy)
SovrnThis is an ad network. (Privacy Policy)
Facebook AdsThis is an ad network. (Privacy Policy)
Amazon Unified Ad MarketplaceThis is an ad network. (Privacy Policy)
AppNexusThis is an ad network. (Privacy Policy)
OpenxThis is an ad network. (Privacy Policy)
Rubicon ProjectThis is an ad network. (Privacy Policy)
TripleLiftThis is an ad network. (Privacy Policy)
Say MediaWe partner with Say Media to deliver ad campaigns on our sites. (Privacy Policy)
Remarketing PixelsWe may use remarketing pixels from advertising networks such as Google AdWords, Bing Ads, and Facebook in order to advertise the HubPages Service to people that have visited our sites.
Conversion Tracking PixelsWe may use conversion tracking pixels from advertising networks such as Google AdWords, Bing Ads, and Facebook in order to identify when an advertisement has successfully resulted in the desired action, such as signing up for the HubPages Service or publishing an article on the HubPages Service.
Statistics
Author Google AnalyticsThis is used to provide traffic data and reports to the authors of articles on the HubPages Service. (Privacy Policy)
ComscoreComScore is a media measurement and analytics company providing marketing data and analytics to enterprises, media and advertising agencies, and publishers. Non-consent will result in ComScore only processing obfuscated personal data. (Privacy Policy)
Amazon Tracking PixelSome articles display amazon products as part of the Amazon Affiliate program, this pixel provides traffic statistics for those products (Privacy Policy)
ClickscoThis is a data management platform studying reader behavior (Privacy Policy)