ArtsAutosBooksBusinessEducationEntertainmentFamilyFashionFoodGamesGenderHealthHolidaysHomeHubPagesPersonal FinancePetsPoliticsReligionSportsTechnologyTravel

A Seismic Trend to Take Seriously
Updated on March 28, 2015
retrojoe profile image

Has studied astrology/historical seismology since the late '70s in San Francisco. Published in the ISAR International Astrologer in 2012.

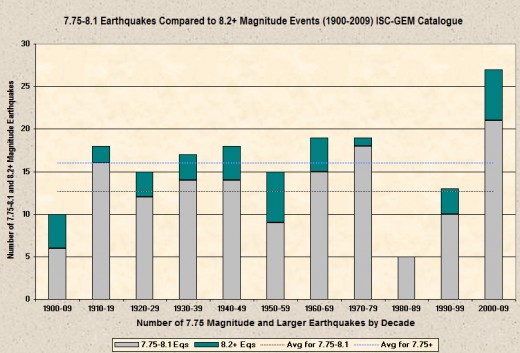
Breakdown of 7.75-8.14 and 8.15+ magnitude earthquakes worldwide from 1900-2009 broken down by decade (data extracted from the ISC-GEM catalogue with the chart produced by the author).
Breakdown of 7.75-8.14 and 8.15+ magnitude earthquakes worldwide from 1900-2009 broken down by decade (data extracted from the ISC-GEM catalogue with the chart produced by the author). | Source

If you do a search on the internet for earthquake statistics you are likely to find a few sites that show earthquakes of 5.0 or greater increasing alarmingly over the course of the past 40 years (the USGS archive search only goes back to 1973). What seismologists will point out to anybody who asks what is up or “..is there a big increase in seismic activity going on?”; they will say that things are within normal parameters and not to worry. One thing I would point out is that as time marches on, more and more delicate detection equipment is set up around the world and thus more and more earthquakes, especially those below 6.0 magnitude are being recorded than was the case just a decade or two ago.

On the other hand, in order to dismiss such suggestions that things are heating up due to such secret government projects as HARP, some scientific minded people do a similar statistical trick to weigh things more in their favor. For example, one such mathematically minded person used earthquakes only in the 7.0-7.9 magnitude range and ignored those above it. Checking such larger quakes one will see that, over the course of the last 13 years, things have been heating up; especially in the 8.4 magnitude and higher range.

And that is what this hub is about. I wish to prove a point that it isn't bad judgement to start anticipating more alarming events than usual. Up at the top is a chart demonstrating how earthquakes have broken all records in the 7.75 magnitude or larger events category during the last decade. The table below shows the data that was used to create the chart. It hasn't ended yet though. As a matter of fact super quake activity appears to be increasing even more. During the past three years there have been 4 earthquakes of 8.2 magnitude or greater or 1.33 per year on average. The frequency during the last decade was 6 in ten years or 0.6 per year on average. In other words, significant seismic events of 7.75-8.1 AND 8.2 magnitude or greater have not only doubled during the last decade when compared to the decade just before that but, at least the largest earthquakes, seem to be doubling again based on the past 3 years of activity.
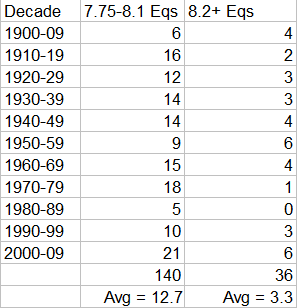
It can be seen that in the last decade the number of 8.2 magnitude or larger earthquakes were tied with the number of such quakes in the 1950s. One thing that is very different this time though is that there was also a great increase in 7.75 to 8.1 magnitude events during the last decade when in the '50s such quakes dipped in frequency.

Also, the seismic energy released during the last decade is also significantly more than in the '50s because of not only the more than double number of quakes in the 7.75-8.1 magnitude range, but also due to the more recent decade including the Sumatra quake of at least 9.0 magnitude that occurred late in 2004. As a matter of fact, if one compares the energy released in that one event, it unleashed twice as much energy as the 21 events of 7.75 to 8.1 magnitude during the same decade. If one combines the energy released from the 5 other events of 8.2 magnitude or higher (with the Sumatra quake of 9.0 magnitude) one gets at least 3.3Xs the energy as was released by the 21 quakes of 7.75 to 8.1 magnitude. Interestingly, the larger number of smaller quakes were 3.5Xs more numerous than the 8.2 magnitude or greater quakes.

Below is a demonstration of this logorithmic novelty which shows that as the magnitude increases the percentage of total energy released during a monthly period also increases vastly, even as these larger quakes become scarcer. And in the opposite direction, although there are about 100Xs more 5.0-5.4 magnitude quakes than 8.0 magnitude or greater, the energy released for those 100 quakes (on average per month) is about 1/160th as much as just one average event in the 8.0 or greater magnitude range.
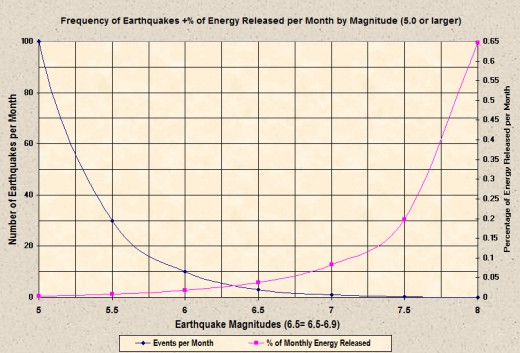
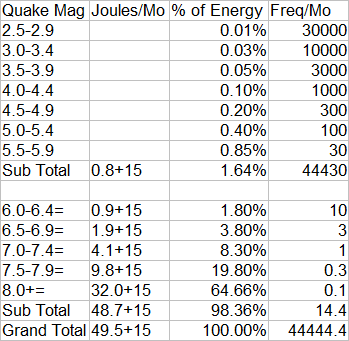
Comparing the monthly averages of worldwide seismic events from 5.0 magnitude upward to the energy that all events within each 1/2 magnitude range releases (data extracted from USGS/NEIC with the chart produced by the author).
Comparing the monthly averages of worldwide seismic events from 5.0 magnitude upward to the energy that all events within each 1/2 magnitude range releases (data extracted from USGS/NEIC with the chart produced by the author). | Source

The first two images early in this hub were the result of data extracted from the recently released ISC-GEM Catalogue that spanned 110 years through 2009. The last two images were the result of information gleaned from the USGS/NEIC catalogue and was also used to produce the next image as well. In this next table we see from the yearly averages that earthquakes in the upper range of 7.75 and above have been increasing steadily since an apparent drought in the 1980-1992 period (the ISC-GEM data shows a yearly average of 0.37 for 8.2 magnitude or greater events from 1900-1969).
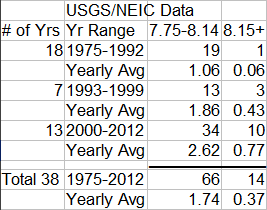
So there you have it, if one is referring to earthquakes that are few in number but are normally responsible (on average) for 70% of all seismic energy released each year, then there has been a definite increase in activity over the course of at least the last 13 years. If one looks at the last 3 years, the yearly average number of such quakes has risen 3.3Xs more than the yearly average (it was 1.6Xs more for the 10 years just prior). Although a statistician would say that there isn't enough data to claim solid results, the general trend is consistently upward and in my eyes it is something to be concerned about.
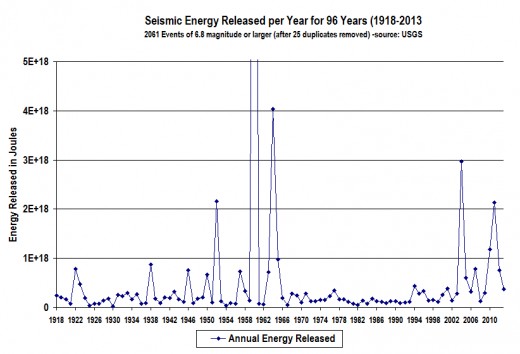

The seismic energy released for the years 1960 and 1964 (go off the chart) are 1.61E+19 and 4.04E+18 respectively.
The seismic energy released for the years 1960 and 1964 (go off the chart) are 1.61E+19 and 4.04E+18 respectively. | Source

© 2013 Joseph Ritrovato

working

This website uses cookies

As a user in the EEA, your approval is needed on a few things. To provide a better website experience, hubpages.com uses cookies (and other similar technologies) and may collect, process, and share personal data. Please choose which areas of our service you consent to our doing so.

For more information on managing or withdrawing consents and how we handle data, visit our Privacy Policy at: https://corp.maven.io/privacy-policy

Show Details
Necessary
HubPages Device IDThis is used to identify particular browsers or devices when the access the service, and is used for security reasons.
LoginThis is necessary to sign in to the HubPages Service.
Google RecaptchaThis is used to prevent bots and spam. (Privacy Policy)
AkismetThis is used to detect comment spam. (Privacy Policy)
HubPages Google AnalyticsThis is used to provide data on traffic to our website, all personally identifyable data is anonymized. (Privacy Policy)
HubPages Traffic PixelThis is used to collect data on traffic to articles and other pages on our site. Unless you are signed in to a HubPages account, all personally identifiable information is anonymized.
Amazon Web ServicesThis is a cloud services platform that we used to host our service. (Privacy Policy)
CloudflareThis is a cloud CDN service that we use to efficiently deliver files required for our service to operate such as javascript, cascading style sheets, images, and videos. (Privacy Policy)
Google Hosted LibrariesJavascript software libraries such as jQuery are loaded at endpoints on the googleapis.com or gstatic.com domains, for performance and efficiency reasons. (Privacy Policy)
Features
Google Custom SearchThis is feature allows you to search the site. (Privacy Policy)
Google MapsSome articles have Google Maps embedded in them. (Privacy Policy)
Google ChartsThis is used to display charts and graphs on articles and the author center. (Privacy Policy)
Google AdSense Host APIThis service allows you to sign up for or associate a Google AdSense account with HubPages, so that you can earn money from ads on your articles. No data is shared unless you engage with this feature. (Privacy Policy)
Google YouTubeSome articles have YouTube videos embedded in them. (Privacy Policy)
VimeoSome articles have Vimeo videos embedded in them. (Privacy Policy)
PaypalThis is used for a registered author who enrolls in the HubPages Earnings program and requests to be paid via PayPal. No data is shared with Paypal unless you engage with this feature. (Privacy Policy)
Facebook LoginYou can use this to streamline signing up for, or signing in to your Hubpages account. No data is shared with Facebook unless you engage with this feature. (Privacy Policy)
MavenThis supports the Maven widget and search functionality. (Privacy Policy)
Marketing
Google AdSenseThis is an ad network. (Privacy Policy)
Google DoubleClickGoogle provides ad serving technology and runs an ad network. (Privacy Policy)
Index ExchangeThis is an ad network. (Privacy Policy)
SovrnThis is an ad network. (Privacy Policy)
Facebook AdsThis is an ad network. (Privacy Policy)
Amazon Unified Ad MarketplaceThis is an ad network. (Privacy Policy)
AppNexusThis is an ad network. (Privacy Policy)
OpenxThis is an ad network. (Privacy Policy)
Rubicon ProjectThis is an ad network. (Privacy Policy)
TripleLiftThis is an ad network. (Privacy Policy)
Say MediaWe partner with Say Media to deliver ad campaigns on our sites. (Privacy Policy)
Remarketing PixelsWe may use remarketing pixels from advertising networks such as Google AdWords, Bing Ads, and Facebook in order to advertise the HubPages Service to people that have visited our sites.
Conversion Tracking PixelsWe may use conversion tracking pixels from advertising networks such as Google AdWords, Bing Ads, and Facebook in order to identify when an advertisement has successfully resulted in the desired action, such as signing up for the HubPages Service or publishing an article on the HubPages Service.
Statistics
Author Google AnalyticsThis is used to provide traffic data and reports to the authors of articles on the HubPages Service. (Privacy Policy)
ComscoreComScore is a media measurement and analytics company providing marketing data and analytics to enterprises, media and advertising agencies, and publishers. Non-consent will result in ComScore only processing obfuscated personal data. (Privacy Policy)
Amazon Tracking PixelSome articles display amazon products as part of the Amazon Affiliate program, this pixel provides traffic statistics for those products (Privacy Policy)
ClickscoThis is a data management platform studying reader behavior (Privacy Policy)