Astrological Link in 4 Out of 10 Months of Earthquakes, This Month Too?

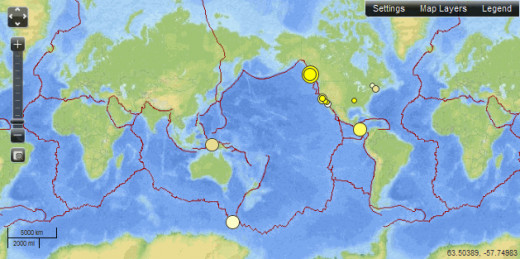

October wasn't busier than usual when looking at 6.5 or greater magnitude quakes (it met the average of 4 such quakes per month). There were two of those quakes inside my prediction windows and two outside and since the windows comprised 42.5% of the time span for the month, the two quakes within the window gave an above average result, but not significant enough to raise a statistician's eyebrow. What would make it more significant would be if we only looked at earthquakes of 7.3 and above. The Quake off the northwest Canadian coast during this month that registered as a 7.7 magnitude event was the largest recorded in that area for 63 years (the same general area experienced an 8.1 magnitude quake there in 1949).
In August and September there were also some noteworthy quakes in the 7.3 or larger magnitude range and they all fell within my windows. If we raise the bar of what qualifies as a significant quake within a predicted window, September has the same high statistically significant results (because there were no quakes from 6.5-7.2 during that month). August had a wide window, comprising 76% of the time during the month which seemed to imply that it would be a fairly big month for quakes (which it was if one looks at just 7.3 magnitude or larger quakes; it had 3 such quakes and the average is 0.65 per month).
April was another super big month, having six quakes in the 6.7-7.0 magnitude range plus an exceptional two quakes of 8.2 and 8.6 magnitude (the monthly average for 6.7 magnitude or greater quakes is 2.5 and the average for 8.0 or higher quakes is about once per year). Using my latest prediction method, the two 8.0+ quakes were within my window along with two of the lesser sized quakes. The length of the windows comprise half of the time during that month so having 4 inside and 4 outside the window is just average for that many quakes in a given month. However, if (by raising the bar) we eliminate all but the two 8.0+ quakes (which releases over 99Xs more energy than the other six quakes combined, the result is 4Xs what would be expected due to chance alone.
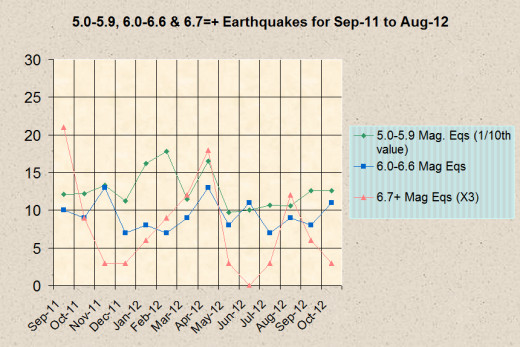
What I'm putting forth here is that it looks like, lowering the bar to include more quakes appears to dilute the results of my predictions. And that by raising the bar from 6.5 or 6.7 to 7.2 or 7.3 would magnify any significance. Below is a breakdown of earthquakes of varying magnitudes by month from September 2011 to the present. Also there is a graphic that displays how significant my predictions (using my current methodology) works out to for the first ten months of this year when the bar is lowered to 6.5 magnitude. Following that is a table that shows how many pico-joules of energy was realeased for 6.7 magnitude quakes or higher during each month and how many of that output occurred during my predicted windows.
, Feb=2 of 3 (0.517), Mar= 3 of 6 (0.495), April= 4 of 8 (0.5), May= 0 of 1 (0.42), June=0 of 0 (0.4), July= 1 of 3 (0.387), Aug= 6 of 6 (0.758), Sep=2 of 2 (0.376), Oct=2 of 4 (0.425)")
Month..... pJ of Energy Released..... Amount of pJ Energy Within Predicted Windows
Jan........ 5....................................... 0
Feb...... 4.2..................................... 0
Mar...... 13..................................... 4.8
Apr..... 630.4................................. 626
May..... 0.7..................................... 0
June.... 0....................................... 0
July.... 0.7..................................... 0
Aug... 43.5................................. 43.5
Sept.. 21.5................................. 21.5
Oct..... 22.................................... 22
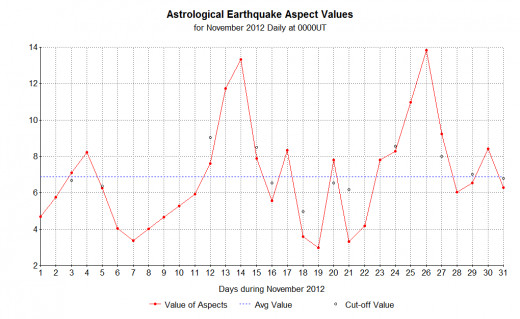
After reviewing my estimates for the upcoming windows (given in my last hub) where Earthquakes should be more numerous in November 2012, I have decided to repost those times due to errors that I found and modifications that were made in the determination of the start and end points for each window. The windows now comprises 32.5% of the time during November 2012 rather than 47% as before. As the above has implied, I am now raising the bar of the predicted quakes to be in the 7.2 magnitude or larger range:
-
Peaks at 2230 on 11/3, starting at 1700UT on 11/2 and ending at 2300UT on 11/4 (centered at 2000UT on 11/3, give or take 15 hours).
-
Peaks at 1315UT on 11/13, starting at 1130UT on 11/12 and ending at 1730UT on 11/14 (centered at 1430UT on 11/13, give or take 27 hours).
-
Peaks at 0505UT on 11/17, starting at 1800UT on 11/16 and ending at 1800UT on 11/17 (centered on 0600UT on 11/17, give or take 12 hours).
-
Peaks at 0015UT on 11/20, starting at 1845UT on 11/19 and ending at 0845UT on 11/20 (centered at 0145UT on 11/20, give or take 7 hours).
-
Peaks at 1515UT on 11/25, starting at 0400UT on 11/24 and ending at 0600UT on 11/27 (centered at 1700UT on 11/25, give or take 37 hours).
-
Peaks at 0415UT on 11/30, starting at 0545UT on 11/29 and ending at 1945UT on 11/30 (centered at 0045UT on 11/30, give or take 19 hours).
Now here is the breakdown for the locations for each of the corresponding windows given above:
-
China; Uzbekistan or Kyrgyztan or Turkey, and for the USA, Alaska or California.
-
Turkey or Pakistan; Italy; Japan; Algeria, and for the USA, same as above.
-
Italy; Pakistan or Iran or Afghanistan or Tajikistan; Algeria, and in the USA, Calif. or Alaska.
-
Turkey or Iran; China; Japan; Colombia/Venezuela; Spain/Portugal, and Calif. Or Hawaii in US.
-
Iran or Pakistan or India; Indonesia or Philippines; Colombia or Argentina or Peru or Ecuador or Venezuela; Japan, and in the USA, California, Alaska, or Missouri.
-
Japan; Greece; Venezuela; Iran, and in the USA, California or Missouri.