DuPont Analysis for a Law Firm

“Law does not exist to provide a livelihood for lawyers any more than illness exists to provide a livelihood for doctors. Successful legal business may be a by-product of law…but it is not the purpose.”
- Richard Susskind
Like any other for-profit business, professional services firms need to understand how they make money if they are to maximize their profit potential. One tool that can be helpful in this regard is the DuPont Identity.
Before the DuPont Equation or DuPont Identity can be applied to a professional services firm (e.g., a law firm), we must translate the three main components of the DuPont Identity – Profitability or Profit Margin, Operating Efficiency and Financial Leverage – into professional services firm language.
Recall that the Dupont Equation decomposes Return on Equity (ROE) into the three components mentioned above as follows:
Profit Margin = [Profit] / [Sales]
Operating Efficiency = [Sales] / [Assets]
Financial Leverage = [Assets] / [Equity]
Multiplying the three elements above gets us to [Profit] / [Equity] or ROE.
For the purposes of this discussion, we will explore the modified DuPont System as described in Maister (1993) to decompose a hypothetical law firm’s return on equity (ROE) into Margin (M), Productivity (P), and the firm’s Leverage (L). ROE for a professional services firm is rewritten as profits per Partner (PPP).
PPP = [Profits] / [Partner]
M = [Profits] / [Fees]
P = [Fees] / [Staff]
L = [Staff] / [Partners]
Along with providing gold-standard client service and top-notch career prospects to associates and staff, a firm’s ability to maximize financial return to its partners is dependent on strong financial performance. Decomposing profits per partner into the three elements of the DuPont Identity can be helpful in maximizing PPP. Each of the three elements is a separate profitability lever that can be measured and managed.
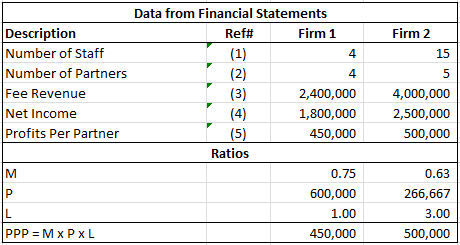
The diagram below provides selected data from the financial statements of two hypothetical law firms as well as calculations of several ratios that we’ll need to walk through the analysis.
The larger of our hypothetical firms (Firm 2) has a higher PPP than the smaller firm ($500,000 vs. $450,000). We can see, though, that the margin (M) the smaller firm is better than for the larger firm (0.75 versus 0.63). And, the productivity of the smaller firm (P) is much better than the larger firm ($600,000 vs. $266,667). What the DuPont approach illuminates for us, in this particular example, is the importance of leverage (L) to the larger firm. Profits per partner are greater in the larger firm because of the high leverage ratio.
M provides insights into the components of the firm’s income statement (how much profit is generated as a ratio of fees). P provides insights into how well the firm utilizes its staff (i.e., fees per billable staff hour as well as billable hours per staff) and L provides insight into how many staff are supported per partner.
A final note of caution: the examples provided here are contrived and were simply used to highlight the importance of all three elements of the DuPont Equation. It would be a mistake to generate these numbers for two firms and declare one better than the other because their PPP or any one of the DuPont elements is better than the other. This is because different types of law require different levels of leverage, demand different fees in the marketplace, etc. Different DuPont results may simply mean that the two firms being compared focus on different practices of law. The tools presented here are best used internally to shed light on areas of how the firm is being managed that could lead to higher profits per partner.
References
Maister, David H.: Managing the Professional Service Firm, Free Press Paperbacks, 1993.
Susskind, Richard: The End of Lawyers? Rethinking the Nature of Law Services, 2008.
Example