Earthquake Weather Report for March 2015


Seismic Activity Heating Up?
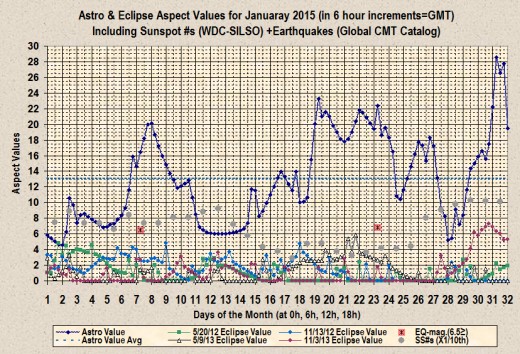
As of November 1st, 2014, five out of the previous five significant seismic events (of 6.8 magnitude or larger; from here on referred to as significant events) fell within windows defined by Astro-aspect values (from here on out described as seismic windows). Around that same time, I predicted that there would be at least twice the number of significant events than usual during the period from November 22 to December 11. As it turned out, activity did not pick up during that time. The reason for that would seem to be related to the fact that that time period landed in the middle of what turned out to be a drought of activity which began just following the November 1st earthquake and may have ended with the February 13th quake.
Before the Friday the 13th earthquake, seven of the prior eight significant events occurring worldwide fell within a seismic window (these windows usually take up around 55% of the time in a given month). It became seven out of nine with that last quake, since it occurred just 59m03s past a small seismic window.
So, from August 2014 thru the middle of February 2015, significant events fell within seismic windows 1.4Xs more often than what would be a statistically average outcome. During the first three months of this period the results were 1.8Xs that of the statistical average, but during the last 3 months, when seismic activity was about 2/3rds of normal, the results only matched the expected average statistically.

During such times as this last downturn in seismic activity, astrology appears to play less of a role or is not a reliable factor in prediction. This is also true for earthquakes below 6.8 in magnitude. What my research has shown is that astrology reflects seismic events best when they are occurring more frequently than usual or are much larger than usual.
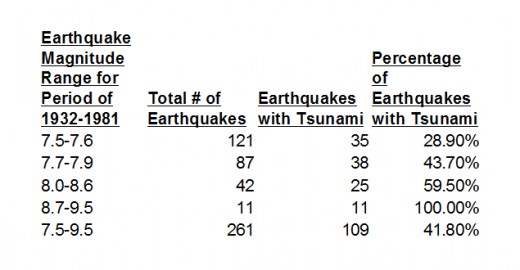
This last relationship can be compared to that of how likely a particular sized earthquake is of producing a tsunami. As shown in the table below, there is almost a 29% chance of a tsunami being produced by an earthquake in the 7.5 to 7.6 magnitude range, and a 100% chance of a tsunami for earthquakes of 8.7 magnitude or more.
The latest batch of earthquakes, a 6.7 magnitude event on the Chile/Argentine border on 2/11/15, the 7.1 magnitude event in the north/central Atlantic ocean on 2/13/15 (almost exactly 2 days later), plus a 6.2 magnitude event in Taiwan (1h07m19s following the 7.1 quake), all appear to signal that seismic activity is about to pick up again. But before we explore what may be about to unfold, let us look more closely at that unusual 7.1 magnitude event of 2/13..
The Friday the 13th quake was the largest earthquake recorded in that particular area of the globe since the year 1900. The second largest was a 7.0 magnitude earthquake which also happened on the 13th of February in 1967 (but then it fell on a Monday). There were no other earthquakes at that magnitude since 1900 also.
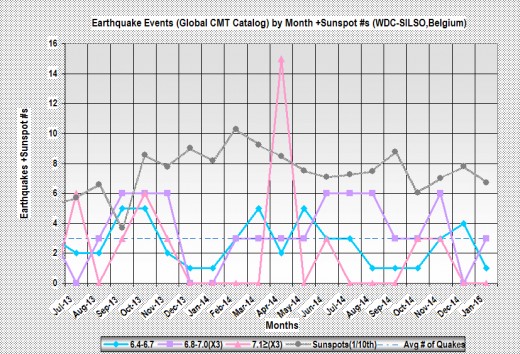
But the story doesn't end there. Another rare earthquake, of magnitude 7.0, occurred at the juncture of three tectonic plates in the south Pacific ocean (called the Southern East Pacific Rise) on October 9th, 2014. The last time there had been an earthquake this size in that area of the globe was on March 20, 1920 (there were no other similar quakes between then and the year 1900). Interestingly, that was a record year for earthquakes of 8.1 magnitude or larger. Three such quakes occurred that year following the March 20, 1920 earthquake. The last of those three, occurring in China in December, caused the death of over 200,000 people.
It is now time for us to take a look at what is to come, based on astrological indicators. Below are the dates that outline the start and end to each seismic window from the middle of February 2015, to the end of March 2015. Significant seismic events of at least 6.8 in magnitude (which normally occur twice per month on average) should fall within these windows at a rate significantly above what the statistical average would indicate.
2015-02/15, 2200 UT – 02/22, 0200 UT: south to east of FL, China/Taiwan, Japan, Aleutians, west coast of U.S. [6d4h]
2015-02/23, 1200 UT – 02/24, 0000 UT: south to east of FL. [12 hours]
2015-03/01, 0000 UT – 03/02, 0200 UT: Papua New Guinea, New Zealand, S. Pacific (mostly north of New Zealand), Panama, Chile, Argentina. [26 hours]
2015-03/03, 1000 UT – 03/05, 0000 UT: Papua New Guinea, Solomon Islands, eastern Indonesia, New Zealand (and the S. Pacific islands north of there). [38 hours]
2015-03/07, 1200 UT – 03/08, 0400 UT: Same as next three date groups. [16 hours]
2015-03/11, 1200 UT – 03/18, 1600 UT: China/Taiwan, Japan, Aleutians, northern California, Papua New Guinea, New Zealand (and/or the S. Pacific islands north of there), Dominican Republic (or surrounding area such as Puerto Rico), Panama, Chile, Argentina. [7 days, 4 hours]
2015-03/20, 1000 UT – 03/24, 1400 UT: Same as last. [4 days, 4 hours]
2015-03/26, 0800 UT – 03/26, 1800 UT: Same as last. [10 hours]
2015-03/28, 0400 UT – 03/30, 0400 UT: Dominican Republic (or surrounding area), Papua New Guinea, New Zealand (and/or the S. Pacific islands north of there), Panama, Chile, Argentina. [2 days]
Total window hours during the month of March 2015: 17d02h or 17.083 days or 55.11% of that month.
© 2015 Joseph Ritrovato


