Earthquake Weather Report for March-April 2013

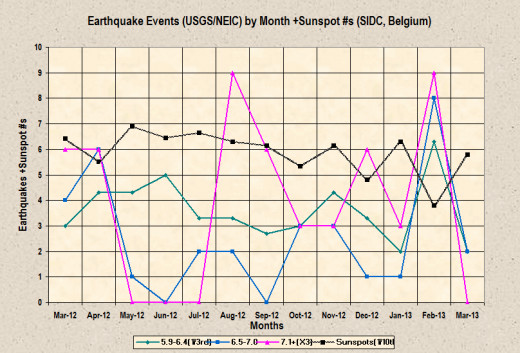
The difference, seismically speaking, between February and March 2013, was like night and day. As can be seen in the graphic chart above, February 2013 had the greatest activity of any month during the prior year. March 2013 turned out to be the lowest month. An average month will produce 3 earthquakes of 6.5-7.0 magnitude and 1 earthquake of 7.1 magnitude or larger. But in March 2013, the month started off with 2 after shocks of a 6.9 magnitude quake in the Kuril Islands.
Those two shocks measured 6.4 and 6.5 in magnitude (although that last quake may actually have been a 6.4 magnitude event as well). Since what I really am aiming for in my predictions are main shocks, and possibly pre-shocks of adequate size, the aftershocks are not part of the equation and thus should not be considered as relevant in the results (as was pointed out in an earlier hub in regards to the many aftershocks to the 8.0 Santa Cruz Island quake in February).
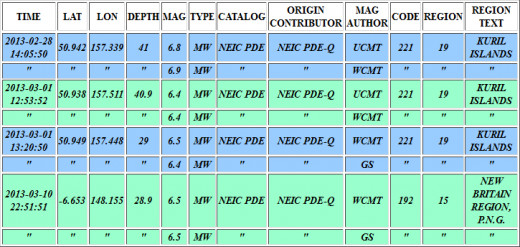
The only qualifying earthquake was one in the New Guinea area of Indonesia on March 10. It measured 6.5 or 6.6 magnitude. That one happened to fall within one of my windows, but since those windows encompassed about 41% of the days during that month, I had that much of a chance (or close to 50-50) of having one quake fall within one of my windows since there was just one significant (6.5 magnitude or greater quake) occurring in that month.
The results were more favorable than if the one quake had occurred outside of my window, but there wasn't enough events to make a case for my prediction. I was expecting more activity than there was, so I got that part of things wrong. In other words, the results for March were not exactly a bulls eye and I am hoping that in April of 2013 events will more accurately fit my forecast (to be presented in this hub).
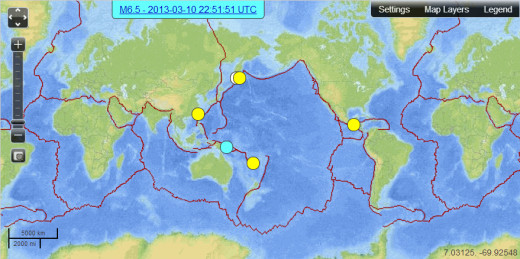

Above is a map displaying quakes of 6.0 magnitude or greater that occurred in March 2013. They amounted to about half of what is normal in any given month. Below is a graphic display showing the earthquake astro values (dark blue line) as they unfold throughout the month of April. Also included are values that represent times when astrology suggests that earthquakes are less likely (hot pink line). They are plotted out every six hours beginning at 00h00m, GMT.
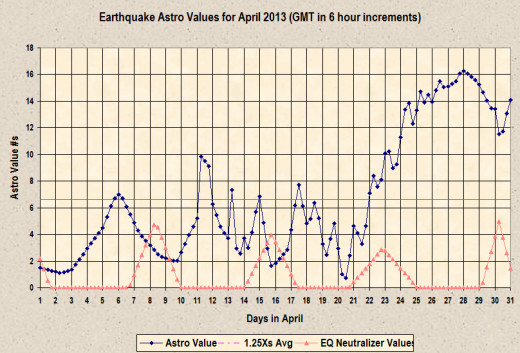
Similar to March 2013, which had windows comprising 41% of the days of that month, April 2013 has 44% designated as window zones. The difference in significant earthquakes failing to accumulate in March 2013 and possibly increasing in the following month may relate to sunspot numbers zigzagging up and down from month to month (see graphic at start of this article). At least for the last few months, when the monthly numbers increased, earthquake activity slowed and when the sunspot numbers dropped, earthquake activity increased. The trend is that sunspots will drop this month significantly from the number total of the prior month and so my hunch is that earthquake activity will be kicked upward again during April 2013.
What follows are my best estimates of windows within which time my astrological interpretations indicate that earthquakes are most likely to occur in April 2013:
4/6/13 0600UTC +-18hrs (peak 0000UTC) Iran, China, Japan, CA, AK
4/12/13 0000UTC +-24hrs (peak 12000UTC, 4/11/13) China, Iran, Mexico, Italy, Chile, Japan, CA
4/18/13 0000UTC +-18hrs China, Iran, Greece, Myanmar, Haiti, AK, CA, ME, HI
4/26/13 1200UTC +-4.5 days (peak 1200UTC, 4/24/13) New Zealand, Chile, Myanmar, Japan, Balkans, Azores, CA, UT, NV, AK
(peak 0000UTC, 4/28/13) Turkey, Mexico, Japan, China, Peru, Bulgaria, Montengro, CA, NV
Copyright © 2013 Joseph W. Ritrovato


