Earthquake Weather Report for September 2014 (plus annual review)


.")
The past year has been a mixed bag of record low months (for earthquakes of magnitude 6.5 or larger there was only one quake that was at least a 6.5 in magnitude on 1/1/14 during December 2013 and January 2014), a record high month (April 2014, when there were 16 earthquakes of magnitude 6.5 or larger when around 4 is what is normally expected), an average year for magnitude 6.8 or larger earthquakes (27 when about 24 is the average; there were 29 the year before; this breakdown counts all aftershocks as well), and 1.4Xs more than usual in the 6.5-6.7 magnitude category (34 instead of the usual 24; there were 22 the year before).
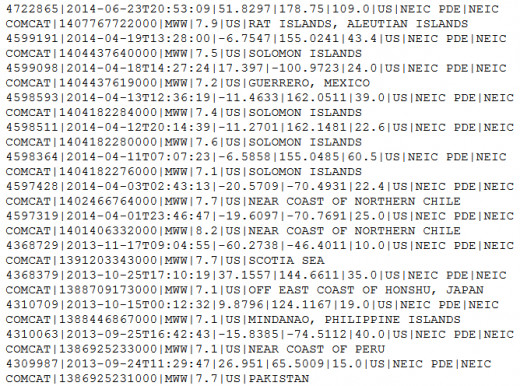
If one looks at the number of earthquakes of magnitude 7.1 or larger for the one year period from 8/1/2013 to 8/1/2014, we again find an average amount (11, nearly half of that in April alone, when 12 is typical). The year before produced almost 1.6Xs more earthquakes (19) of this size range. Looking at how many of the 11 earthquakes fell inside windows that were based on Astro-aspect Values, we find 8 inside and 3 outside the windows (1.45Xs more inside than the expected average). The amount of time in a month that the windows occupy comes out to approximately 50% each month.
Confirming my conclusion that astrology plays more of a key role in the unfolding of magnitude 6.8 or larger earthquakes when activity is well above average, in April, when there were 9 such quakes (when 2 is the norm), all of these earthquakes fell within my projected seismic windows. In contrast, there were 18 such quakes during the other 11 months of the year (when 22 is the statistical average) and the results were 9 inside the windows and 9 outside (or showing no statistical significance).
When looking at just the earthquakes of magnitude 7.1 or larger, there was a decline of from 19 to 11 earthquakes during the year 2013-14 when compared to 2012-2013. There was also a decline in significance for my results with 1.45Xs more earthquakes inside the windows than the statistical average for the year ending 7/31/2014, while the year before that yielded almost 2Xs more earthquakes of that size inside the windows than the statistical average. Interestingly, the earthquakes of 6.8-7.0 magnitude (again for the year ending 7/31/2014) equaled the same number (11) as with 7.1 magnitude and above (also average results) and had the same percentage breakdown of events inside the windows for both magnitude ranges (inside again equaling 1.45Xs more than the statistical average).
If anybody reading this noticed that the actual number of events used for my breakdowns is larger than I give here, it is because I am not counting aftershocks in my analysis (I do however count pre-shocks in the magnitude range reviewed if they occur more than a few hours in advance). I wish to stress here that the projected windows, when seismic activity should be heightened, now occupies 50% of each month rather than 33% as it was before.
July 2014 turned out to be average for earthquakes of at least 6.8 in magnitude (such large temblors are labeled by me as significant events). There were two such quakes that month when I was expecting at least three (see the hub just prior to this one for a graphic showing my windows, significant earthquakes, and sunspot numbers). I am also expecting an above average trend for August 2014, but after a flurry of activity near the beginning of the month, it appears that things have slowed down since. It will be interesting to see if significant events start to pick up again as we approach September 2014, which is a month that I at first thought would produce above average activity based on my newest algorithm but, resorting to an earlier set of aspect values (since my latest set of aspect values went a bit off track) makes September 2014 look more average. Time will tell.
.")
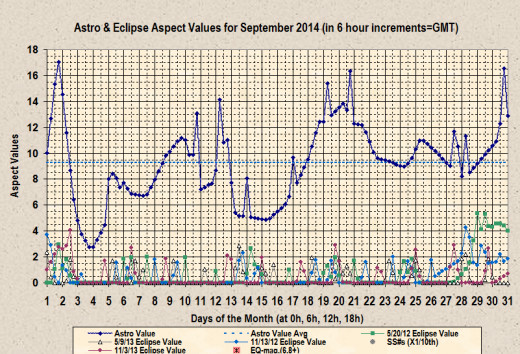
[Like August 2014, when I compared results for mapping out my windows based on two separate algorithms that relate to the astro-aspect values, the September 2014 results vary even more since I did an exhausting update to my list of astrological aspects and their values. Unfortunately, I now feel that I tinkered too much and have moved back the clock a bit on my algorithm development and now choose to use values that are about 2 weeks newer (dated 7/24/14) than that used for the original August 2014 graphics (instead of 5 weeks newer or dated 8/12/14; that one being used to produce the most recent September 2014 graphics).]
We have now arrived at the point where I translate the dates, times, and potential locations of significant earthquakes for the coming month, or in this case, September 2014. The percentage of hours of that month used for the seismic windows comes out to 52.2% this time.
2014, 09/01, 0000 UT to 09/02, 1200 UT (36 hours): China/Taiwan, Japan, Aleutians, S.OR &/or N.CA, N.&/orE. of Australia, Chile &/or Peru, S.&/orE. of FL.
2014, 09/04, 1800 UT to 09/07, 0500 UT (59 hours): S.&/orE.of FL
2014, 09/07, 1500 UT to 09/11, 0200 UT (83 hours): W.coast of USA, S.&/orE. of FL.
2014, 09/11, 1630 UT to 09/13, 0730 UT (39 hours): S.&/orE. of FL.
2014, 09/13, 1900 UT to 09/14, 0600 UT (11 hours): Papua New Guinea, Solomon Islands, S.Pacific, N.&/orE. of Australia, Chile &/or Peru.
2014, 09/16, 1300 UT to 09/17, 0730 UT (18.5 hours): China/Taiwan, Japan, Aleutians, S.OR &/or N.CA.
2014, 09/19, 0300 UT to 09/19, 1100 UT (8 hours): same area as last window.
2014, 09/20, 1500 UT to 09/20, 2300 UT (8 hours): S.&/orE. of FL.
2014, 09/23, 0000 UT to 09/24, 0230 UT (26.5 hours): N.orE. of Australia, Chile &/or Peru, S. Pacific, S.&/orE. of FL.
2014, 09/27, 0900 UT to the end of the month (87 hours): N.&/orE. of Australia, Chile &/or Peru, S. Pacific, China/Taiwan, Japan, Aleutians, S.OR &/or N.CA, S.&/orE. of FL.
© 2014 Joseph Ritrovato


