Earthquake Weather Review-Report for May-June 2015


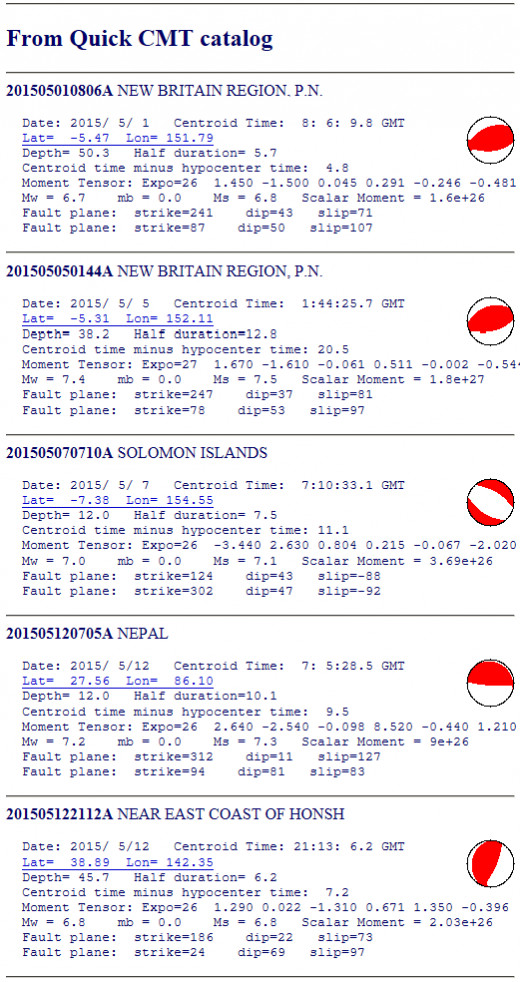
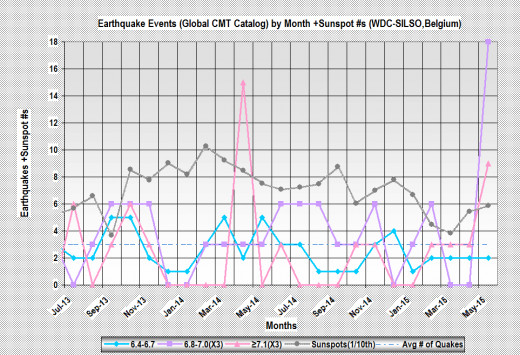
The month of May for 2015 looked something like the very busy month of April 2014, just a little busier. Both months were record setters for earthquakes of at least 6.8 magnitude (see graphic below for a comparison).
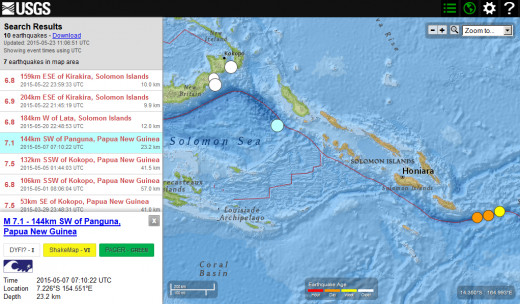
In April 2014, it started off with an 8.2 and 7.7 magnitude series of quakes in northern Chile at the start of the month, followed 8 days later by a string of 6.8 magnitude or greater worldwide earthquakes, 7 in number, spread out over 12.5 days. The busiest location was the far eastern part of the Papua New Guinea (PNG) region to the southeastern section of the Solomon Island region (with 4 out of the 7 quakes).
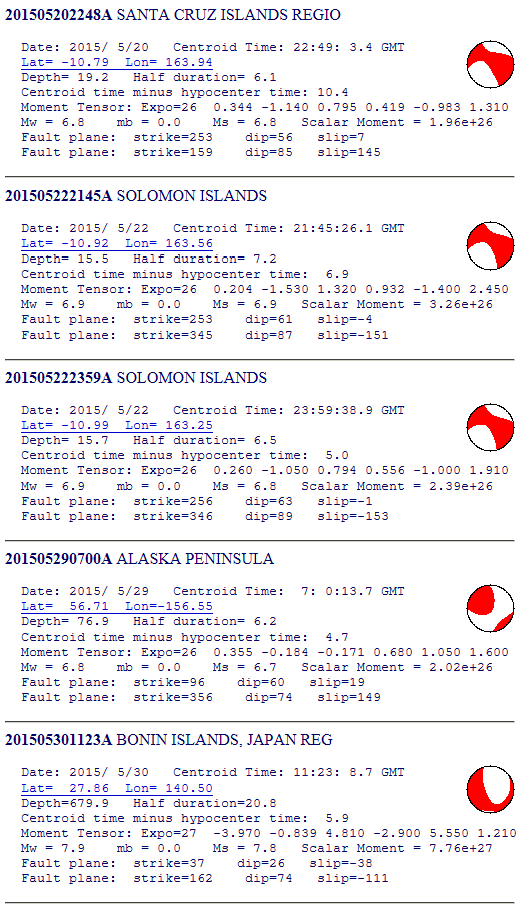
In May 2015, it began with the 7.8 magnitude earthquake in Nepal on 25 April 2015, followed 6 days later by a string of 6.75 magnitude or greater worldwide earthquakes, 10 in number, spread out over 29 days (or most of the month). The busiest location was again involving the far eastern end of the PNG region, extending to the southeastern section of the Solomon Island region (with 6 out of 10 earthquakes). The second busiest area was Japan, with 2 of the 10 quakes.
The Japanese earthquake of 7.85 magnitude, which occurred on May 30, was a record setter, appearing to have occurred at the deepest portion of the earth's mantel possible (anywhere from 677-695kms). It also was just deep enough and far enough away from Tokyo to spare the people there any damage or mortality. It did however knock out power temporarily in places and shook up the locals for some time (the shaking, at least for those in high rises, was like being in a boat on choppy water and went on for a long time). This earthquake may have been related to the eclipse of 20 May 2012, when the moon's shadow passed along the eastern coast of Japan. It may also have been an omen of much more damaging earthquakes to come there; quite possibly within the next few years.
Returning to the area east of PNG that was so active in both April 2014 and May 2015; although there were fewer earthquakes within that region back in April 2014, they released more energy, since three of them had magnitudes of 7.4, 7.5 and 7.6 (in May 2015, there was just one large shock of 7.5 magnitude). Both series of shocks were possibly related to the 10 May 2013 solar eclipse, which cast a shadow through the same area. These earthquake storms may relate to future earthquakes to come of much greater intensity. Again, like in Japan, larger, more damaging earthquakes are a strong possibility within the next few years.
But future damaging earthquakes of course aren't just limited to these areas. These two worldwide swarms of magnitude 6.8 or greater quakes could herald an increase in worldwide activity in the next few years. The reason for this is because of how unprecedented it is to have record setting concentrations of very large earthquakes separated by just 13 months of time. Such rare events are usually separated by decades rather than months. It's as if the world has acquired a malady with symptoms of periodic convulsions and the symptoms are progressing to a point that is alarming.
Again looking at the PNG/Solomon Islands region.. This, one of the most seismically active zones of the earth along the Pacific ring of fire, is also one of the least well understood regions by seismologists. The main reason for this is its remoteness in time and space. Time moves slower here and not too many people outside of that area come to visit and mingle with the natives. Seismic monitoring here was much less complete than most other areas of the globe during the first 62 years of the 20th century. After that, as shown in the graph below, activity appears to really pick up, but most of this is likely due to better detection of earthquakes in that region under 7.0 in magnitude from that point forward.
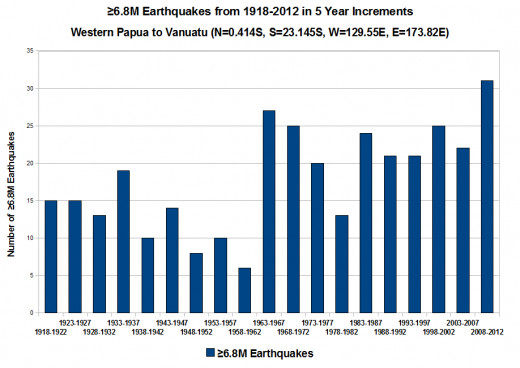
If we look at the last 5 year segment in the graph for the years 2008-2012, we notice that a record was set at that time. Not only that but, not quite midway through the next five year segment for 2013-2017, there have already been 19 events of magnitude 6.8 or higher in the same region. If it continues at that rate, the total for such quakes will be 39 by the end of the present 5 year period (which would set another record).
As for how my forecast did for the month of May, it set a record as well. The last nine magnitude 6.8 or greater events all fell within the seismic windows (defined by astro and eclipse aspect values) that had been mapped out two hubs previously. Since these windows occupied 58.2%, or 18 days out of the 31 days in the month of May, the statistical average of what to expect would be 5.8 earthquakes inside windows and 4.2 outside of them. Thus, the 9 earthquakes inside the seismic windows are over 1.5 times more frequent than the expected average.
 and mean daily sunspot #s (WDC-SILSO, Belgium)")

Now it is time for the forecast for the month of June 2015. Will seismic activity continue at a heightened rate or will it slow down? Based on how the astro +eclipse value aspects play out, it looks like it may just continue for the first half or two thirds of the month of June. The following is the forecast dates and potential locations for significant earthquakes (magnitude 6.8 or larger) based on peaks in astro & eclipse-aspect values for the month of June 2015. Total seismic window days equals 18d2h or 60.3% of the time during the month of June 2015. All of the windows have the following as potential locations: Papua New Guinea and Nepal. The first 3 windows have the following as potential locations: Mexico, Chile, Aleutians, Kamchatka, Solomon Islands, and New Zealand. The dates and times for all of the windows in June 2015, and all other possible locations are listed below:
1st Window: 2015-06/01 0000UT – 2015-06/05 1800UT [4d18h]: Sumatra, India, Iran, Iraq, Turkey, Japan, Iceland +locations from next window...
2nd Window: 2015-06/06 1800UT – 2015-06/08 0400UT [1d10h]: Central America, Colombia, Peru, and California.
3rd Window: 2015-06/10 1000UT – 2015-06/17 0600UT [6d20h]: Iran, Japan +locations from last window.
4th Window: 2015-06/20 0600UT – 2015-06/22 0000UT [1d18h]: Kamchatka +same as next window.
5th Window: 2015-06/24 0200UT – 2015-06/25 1800UT [1d16h]: Sumatra, India, Iran, Iraq, Turkey, and Iceland.
6th Window: 2015-06/29 0800UT – 2015-07/01 0000UT [1d16h]: Same as 4th window.
Peak Dates:
1st Peak: 2015-06/01 1400UT – 2015-06/02 0000UT [10h] Nepal, Papua New Guinea (PNG), India, Iran, Iraq, Turkey, Aleutians, Mexico, Central America, Kamchatka, Japan, USA.
2nd Peak: 2015-06/02 1500UT – 2015-06/03 0000UT [9h] Nepal, PNG, India, Sumatra, Iran, Iraq, Turkey, Iceland.
3rd Peak: 2015-06/05 0700UT – 2015-06/05 1700UT [10h] Kamchatka, Aleutians, New Zealand, Nepal, S. Chile, Mexico, PNG, Solomon Islands.
4th Peak: 2015-06/06 1800UT – 2015-06/08 0300UT [33h] Aleutians, Mexico, Chile, Kamchatka, PNG, Solomon Islands, Nepal, Central America, Colombia, Peru, Japan, USA.
5th Peak: 2015-06/10 1000UT – 2015-06/11 0000UT [14h] Nepal, PNG, Solomon Islands, Aleutians, Kamchatka, New Zealand, S. Chile, Mexico, Sumatra, India, Iran, Iraq, Turkey, Iceland.
6th Peak: 2015-06/13 2300UT – 2015-06/15 1300UT [38h] PNG, Solomon Islands, Kamchatka, Aleutians, New Zealand, S. Chile, Mexico, Iran.
7th Peak: 2015-06/20 0800UT – 2015-06/22 0000UT [40h] PNG, Iran, Nepal, Sumatra, India, Iran, Iraq, Turkey, Kamchatka, Iceland.
8th Peak: 2015-06/24 0300UT – 2015-06/24 1100UT [8h] Nepal, PNG, India, Sumatra, Iran, Iraq, Turkey, Iceland
9th Peak: 2015-06/25 0700UT – 2015-06/25 1900UT [12h] Same as 8th Peak.
10th Peak: 2015-06/30 1000UT – 2015-07/01 0000UT [14h] PNG, Iran, Iraq.
Total peak windows: 7d20h (or 26.1% of months time)
© 2015 Joseph Ritrovato


