How to Graph a Rational Function

Rational Functions!

What is a Rational Function?
Rational - A rational number is a number that can be written as a fraction, repeating, or terminating decimal.
Function
A function is a relationship between an x value and y value. The input and output values of a function relate to one another.
A function must work for every input value. It also must have only one y value for every x value.
Remember the vertical line test. For every x there must only be one y value or it is not a function.
A Rational Function is a function that is written as a ratio or division of polynomial functions.
Polynomial functions are functions that contain more than one term. Poly refers to many. Bi refers to two.
Basic Rational Function

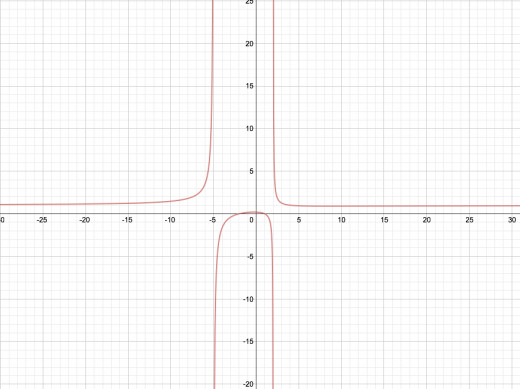
Graph the Function


Graphing the Function - Asymptotes
The first thing you look for when graphing a rational function is the asymptote of the function.
The vertical asymptote is when y approach f(x) x approach + or - infinity.
The horizontal asymptote is an imaginary line where the
Finding the Intercepts
The next step is to figure out where the function passes through the x and y axis. These are referred to as the intercepts.
You are looking for the value of x when y =0 and the y value when x=0. Find the value and put the in coordinate point form.
Plot these points on the graph.
Plot a Few Points
Plot several points close to key features of the function in order to sketch out what the functions looks like. I like to plot points that will start to show the shape of the function.
In the example I plotted several points so that I can begin to see the shape which this function creates.
Connect the Dots
Connect your rough sketches of your points and extend the lines onward to create a graph of a radical function.
The example shows a curved radical function. Notice that connecting the dots is more fluid than when you were in kindergarten.
My Favorite Online Graphing Tool
- Desmos Graphing Calculator
A beautiful, free, online graphing calculator from desmos.com
Using Tools to Graph
Online graphing tools can help easily and effectively graph these lines. These tools are free and easy to use. They preform similar functions as a graphing calculator but are easier to read and manipulate the data as needed.
Quiz Time
Quiz
Think about the radical function, both the graph and the function are shown.
See if you can identify the key elements of the radical function.
Use Your Knowledge Base
Use what you already know about functions, graphing, and polynomials to help you graph rational functions. Remember these are rational numbers so there will not be answers that include complex or imaginary roots.
Use your graphing calculator and tools to help you find the information you need to graph the function.
Use online tools to create a graph that you can print out and attach to your homework if necessary, make sure your teacher allows this first. They may require to see your input and work that went along with your print out if this is excepted.


 Games Ever")