Reviewing Past Year of Earthquakes a Game Changer


When I first started my attempt at predicting the most likely times that a significant earthquake should occur in a given month, my definition of significant was one of 6.7 magnitude or greater. I then lowered the bar to include 6.5 and 6.6 magnitude earthquakes. However, after reviewing the past year of worldwide earthquake activity, I have reached the conclusion that my results work best for earthquakes of a larger caliber.
Based on 20 years of event data from the USGS (ending shortly before the past year of activity), there are 3 earthquakes of magnitude 6.5 to 7.0 occurring throughout the world in an average month. Earthquakes above that occur on average once each month.
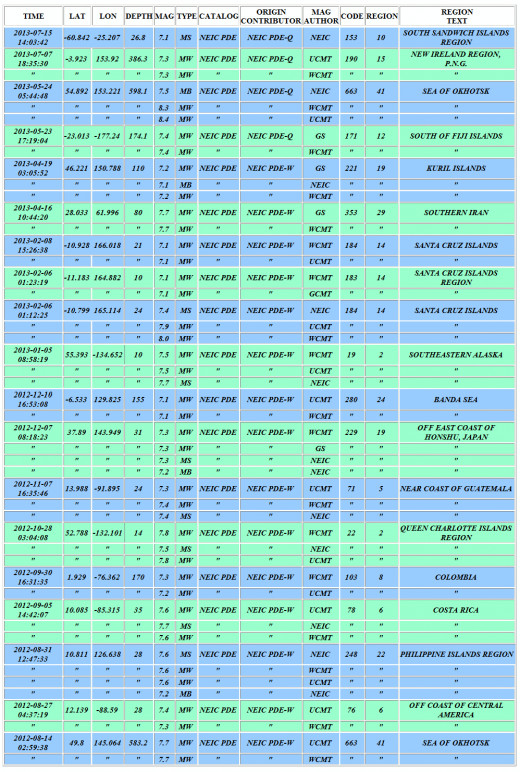
During the past year (beginning in the middle of July, 2012) there were 33 worldwide earthquake events of from 6.5 to 7.0 magnitude. At the same time, 19 worldwide earthquakes took place for the 7.1 magnitude or greater category. Since normally there would be 12 such events in a year, the total for this past year was 1.6 times more active than the average previous year (again during a 20 year period). The earthquakes in the 6.5-7.0 magnitude range were just about average.
Although there were more quakes in the 6.5 to 7.0 magnitude range, the ones above that released considerably more energy. This was due partly due to the logarithmic nature of the seismic magnitude scales and also because there were two quakes of 8.0 or larger during the year studied (when one such quake would be a bit more typical), this smaller group of large sized quakes produced 17 times more energy than the larger group of smaller sized earthquakes reviewed here.
In studying how these smaller earthquakes related to my earthquake windows (defined by over 90 astrological aspects that were found to relate statistically) the outcome yielded disappointing results. However, when I narrowed it down to just the earthquakes of 7.1 magnitude or greater, the results became very significant.
By removing the magnitude 6.5 to 7.0 events, which in this case was 63.5% of the total (should be more like 75% in an average year), I was leaving out the seismic events that produced just 5% of the energy. This resulted in a solid core of seismic data that is responsible for the vast majority of energy released annually.
The average monthly percentage of time used for my windows came out to 32.2% for the period studied leaving 67.8% for the days outside of the windows. Statistically, if ideal random models were used, 6 earthquakes should have been expected to fall inside the windows and 13 outside of them. Instead, of the 19 quakes of 7.1 magnitude or larger, 12 such quakes fell within the windows and 7 outside of them (or just about the opposite of what would be expected).
In other words, there was nearly twice what would normally be expected statistically occurring within the designated windows and almost half as much as one would expect outside of those window zones. Furthermore, if one looks at the energy released inside and outside of those windows, one finds that during the past year, there was 5 times more energy released for quakes within the windows than for those outside of them. What one would expect statistically is that the energy released from seismic events outside of the windows should have been 4.1 times more than how it turned out (resulting from 13 rather than the actual 7 earthquakes). For the seismic events inside the windows, they produced 2.6 times more energy, resulting from 12 actual earthquakes rather than the 6 that would have been expected if astrology played no role in earthquake activity.
One might ask why I did not wait till the end of July before assessing the data. There are two reasons for this. The first is that since earthquakes in the 7.1 magnitude or larger range have been averaging 1.6 such events per month, and there have been 2 such events already in the first half of July, 2013, there is not a strong probability that there will be another one for the second half of the month. If there is perhaps one more, it will be approximately twice as likely to fall within one of the two windows that I depict in the following chart and define in writing after that. Oh.. The other reason is I had the immediate need to do some number crunching and the time available to do it.
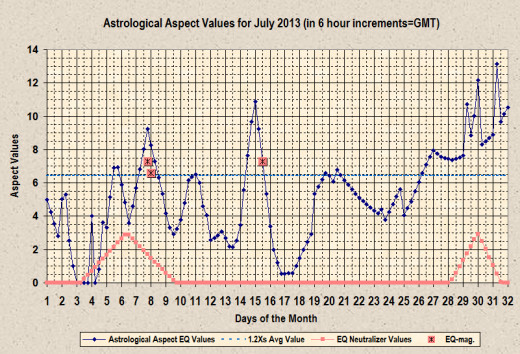
Upcoming Earthquake Windows and Potential Location of Epicenters
For window that opens on 7/19/13 at 1200 GMT and closes on 7/21/13 at 0000 GMT:
Peak on 7/20/13 at 1200 GMT: Turkey, Indonesia, Japan, Greece, Italy, China, CA, AK
For window that opens on 7/26/13 at 0000 GMT and closes at the end of the month:
Peak on 7/27/13 at 0000 GMT: Canada (BC), Peru, Iran, Turkey, Italy, Chile, Greece, AK, CA.
Peak on 7/30/13 at 0000 GMT: Turkey, China, Ecuador, Iran, Russia, Mexico, Chile, AK, CA.
Peak on 7/31/13 at 0600 GMT: Turkey, Italy, Peru, Mexico, Ecuador, Philippines, CA, AK.
Copyright © 2013 Joseph W. Ritrovato