Something Old, Something New (more on Sunspots and Earthquakes)
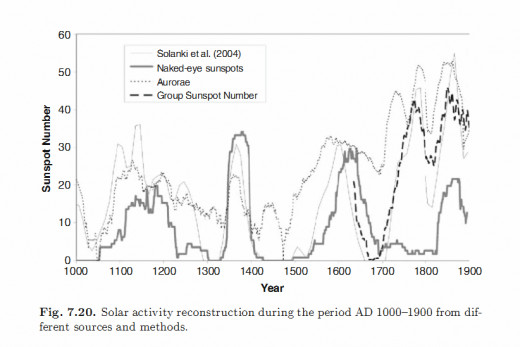
My last hub reintroduced a graphic that I created from an even earlier hub that showed how destructive earthquakes increased significantly during the maunder minimum, a period from 1645-1715 during which the sun produced very few sunspots. This time I am digging even further back in time to other sustained minimum sunspot periods and finding that there is again a correlation between a paucity of sunspots and a plethora of deadly earthquakes. In the graphic below one can see a match or near match for three other lengthy minimum periods since 1000AD. The not perfect alignment can be attributed in part to the fact that these other minimums were determined with carbon dating and that method of dating things can be a few decades off (notice that the years are rounded off to the nearest decade).
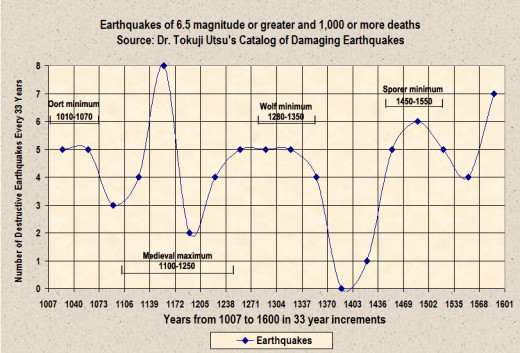
Pay no attention to the spike at the far right during the late 16th century. The likely reasons for the increase at the last minute are twofold: First, there are the superstitious among us who pay more attention to earthquakes during each century's end, causing more to pray and record every quaking of the earth in their diaries, and second, since scientists began taking greater interest in earthquakes around that time, more care was taken in observing and recording them by those with more rational sense.
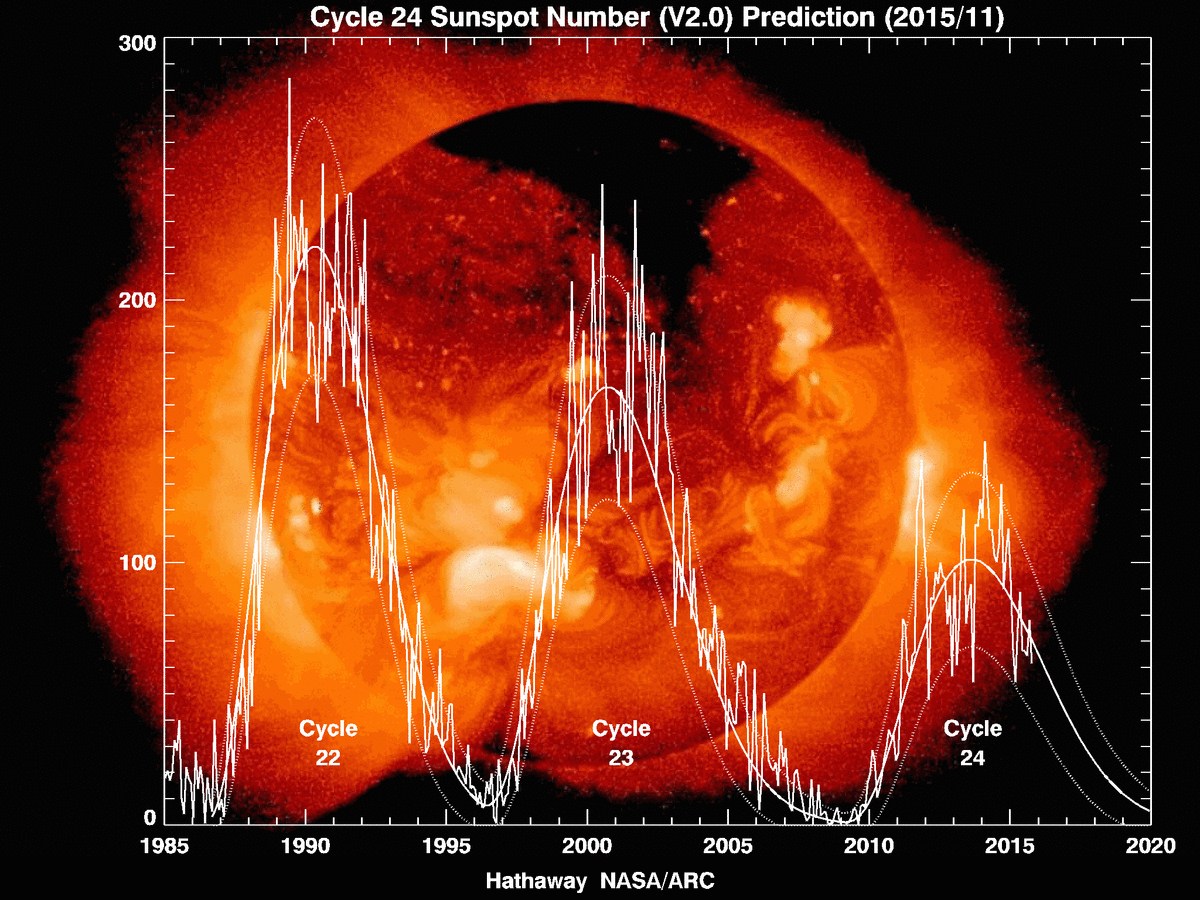
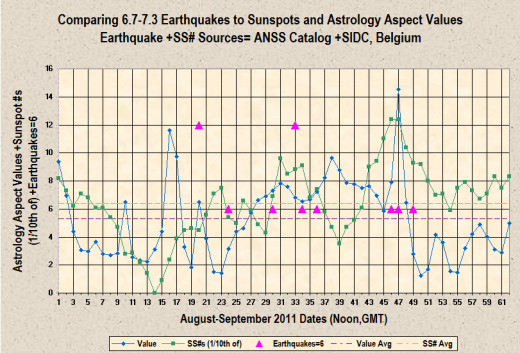
We are of course in a similar period now, since the Mayan calendar ends a long cycle on December 21, 2012. Strangely, there may just be something to that, since there could very well be a flurry of activity from December 16 to February 7 (see my last hub for more on this date range). One of the last displays of seismic intensity occurred during August-September 2011 (see graphic below) or about when the sun's northern hemisphere was peaking in sunspot activity. There is expected to be another peak within the sun's southern hemisphere in early 2014 and the 12/16-2/7 period is expected to be at the midpoint between the first and second peaks of sunspot activity.
There is usually an increase in destructive earthquakes at solar maximum as well as the more consistent amplification during solar minimum. The former is especially true when the peak of activity is a dwarfed version, which also occurs just before the sun's spot creation enters a lengthy hibernation. But, during lengthier than usual solar maximums, there is often a flurry of earthquakes as things slow down a bit between the two peaks.
Since the solar minimum period just experienced is likely to have been longer than the peak that the sun is presently in (but the jury is still out on that one; I'm speaking in terms of what is usual and the sun is presently in an unusual mode), there are between two and three times as many examples given (later in this hub) during minimum than at maximum. Since the sun is only about halfway done with it's current peak in sunspots, there should be more fireworks and significant earthquakes to come.
As we have already seen, there is an increase in the concentration of earthquakes during a lack of sunspot activity that lasts decades rather than years. There has also been a similar increase measured in years at solar minimum, but this was especially true during the last 50-60 years when the sun had record highs of sunspot creation. What I have noticed is a general tendency for their to be the highest concentrations of earthquakes at such times or the lows between extreme highs. Also, there seems to be more earthquake activity at sunspot maximum when the peaks of such are stunted or almost non-existent.
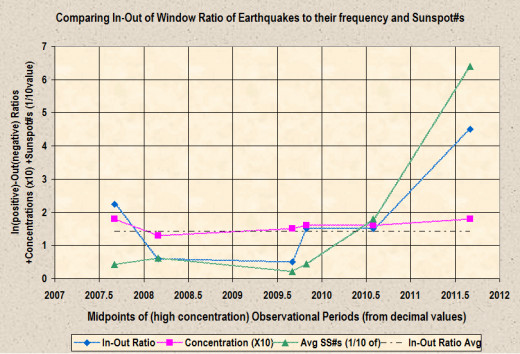
In my review of the past few years, I of course was also interested in how the values of my astrological influences would compare to earthquake activity. Confirming my hunch; times of highest seismic concentration are more likely to fit into my windows (the illustration above is the best example of that). Of the periods of high concentration shown in the table below, the two with the lowest concentration turned out to also be the only ones studied that had more earthquakes fall outside my astrological windows than inside.

The apparent relationship between earthquakes, sunspots, concentrations, and in & out ratios is shown in the graphic below:
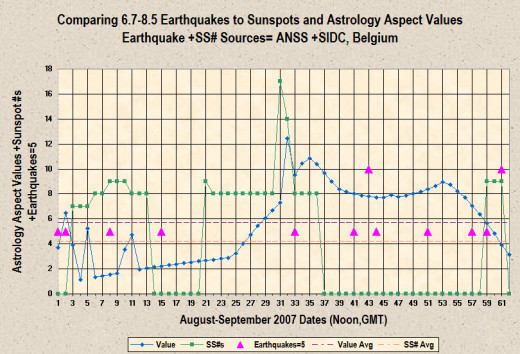
The other 2 month period which was tied for top concentration also was at the beginning of the lengthy and extremely low solar minimum and also the second place finisher out of the four, two month periods that had more quakes inside the astrological windows than outside (shown below):
Of the two examples where there were more quakes outside the windows than inside, the one with the greatest trend in that direction occurred as sunspots were on the upswing or just as things were preparing to exit solar minimum (see below):
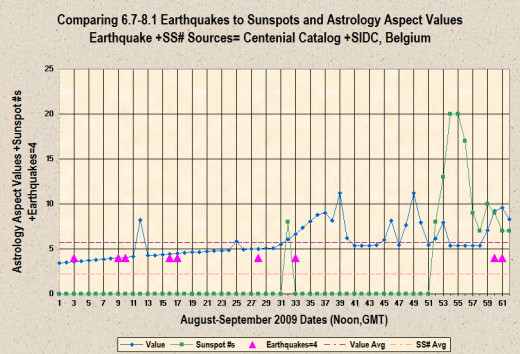
Strangely, this trend was reversed in the two months following it (the only back to back period during the 2007-2012 years time frame studied).
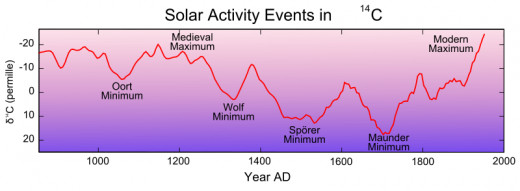
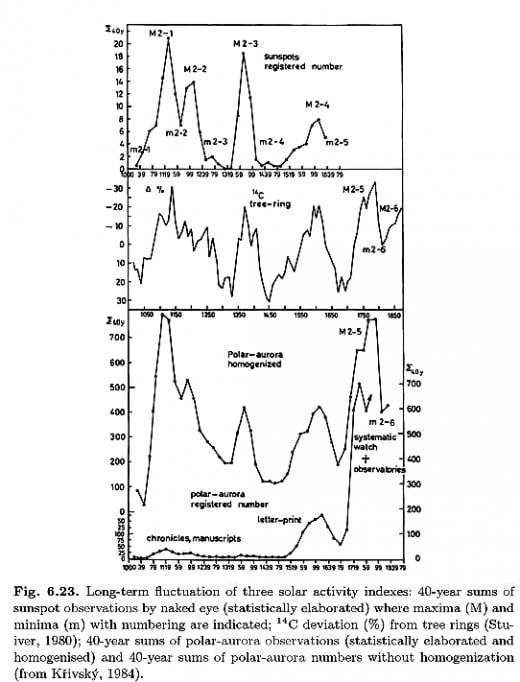
Update: Just discovered two graphic displays indicating the best chronology of sunspots pieced together from observations in the late 13th and early 14th century that shows that the Wolf minimum occurred earlier than the carbon dating records show (and thus more in line with the earthquake record back then as displayed in the second image in this hub). In other words, it appears to me that it began somewhere near the year 1245 and ended approximately in the year 1335 (based on the first illustration) or from 1225 to 1330 (based on the second illustration). Averaging the two estimates yields a period from 1235 to 1332.5 (which again aligns well with the increased period of earthquake activity at that time). I am including this new data below:
© 2012 Joseph Ritrovato

