Sunspots & Earthquakes & UFOs (Oh My!), Part 2
More Visual Aids for the Unconvinced..
Back in the mid '90s I discovered what I am convinced was a link between heightened UFO activity and the minimum years of the solar cycle. I learned this after finding a similar link between sunspot and earthquake activity. However, I now know that there are exceptions to the rule and the reason has to do with the length of each sunspot cycle. The sun has a 22 year cycle of activity, but it's more commonly linked to its 11 year sub cycle.
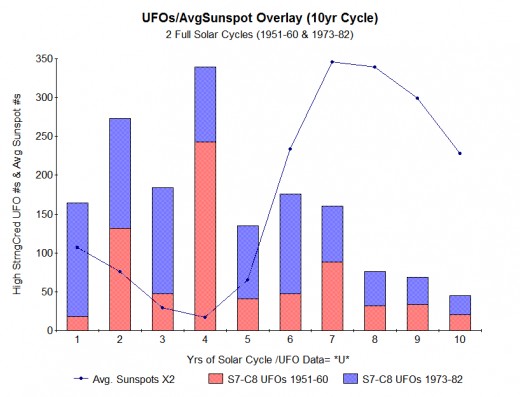
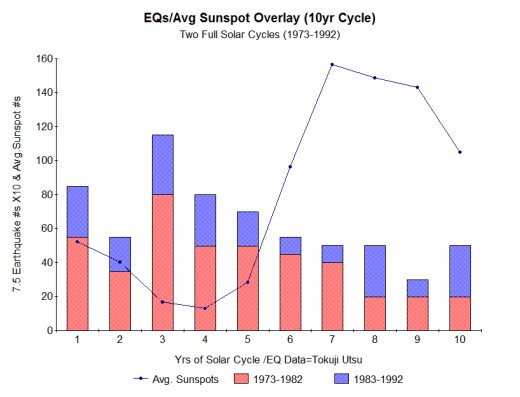
When the sun is going through a period of producing higher than average sunspots, the length of its half cycle is a bit less than 11 years. Conversely, when solar activity is lower than average, the length of its sub cycle is a bit more than 11 years. When the cycle is ten years in length, the correlation between periods of minimal sunspot activity and UFO or Earthquake activity is at its most pronounced and consistent (as shown in the two graphic illustrations below). In both examples the peak (in the number of UFOs and 7.5 magnitude or higher earthquakes) is within a 6 year window centered between the year of solar minimum and the year before.
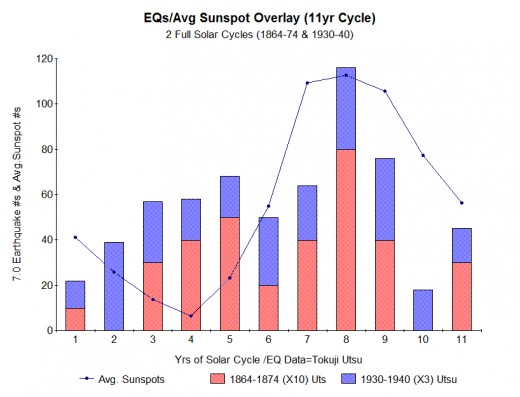
The next example shows what happens with earthquake activity when a solar period is of normal intensity or 11 years in length. The emphasis now shifts to a peak in earthquakes at just the time of solar maximum (give or take a year). There is also a secondary peak in the year of solar minimum (give or take a year).
In the final example, demonstrating the effects from a 12 year solar cycle, there is again more emphasis in earthquake activity when the sun is at or near solar max, but this time it is a wider, 4 year window that is centered about 1.5 years after the middle of the year that sunspots are at a maximum. There is also a very wide secondary peak of 6 years in length centered between the year of solar minimum and the year before that. The two peaks are also closer to each other in intensity than they are in the prior example for an 11 year cycle.
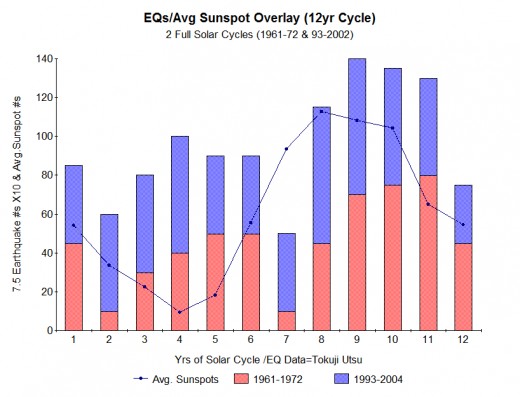
One thing that is interesting about this last example is that activity is heightened almost across the board with only a one year gap between the two peaks in earthquake numbers. This demonstrates that earthquake activity should be at its highest when the solar cycle lengthens beyond its average (which also signifies less substantial peaks and deeper and longer lows of sunspot activity). We are presently in the midst of such a scenario of solar activity as shown in this last illustration.
Since we are presently in a year that corresponds to column 7 in the last example, I don't expect much more than average earthquake activity at present but, beginning in 2013 and lasting through 2016, there should be many more worldwide earthquakes than is usual. That would be on the order of 50% more than the average. In other words, instead of expecting about two earthquakes of 6.7 magnitude or higher each month, three should materialize instead.
Copyright © 2012 Joseph W. Ritrovato


